
LES-211 · Lesson 2 of 12 · 20 min
Youth crime: patterns, trends and disparities
▶ Video coming soon A video version of this lesson is on the way.
Bell begins the second class with a question: 'Is youth crime getting worse?' Most of the students say yes. Several mention news stories about teenagers and car thefts, a video of a fight outside a mall that went viral, and a sense that young people today are more violent. Bell nods. 'That is what most people believe, in almost every generation,' he says. 'Let's look at what the numbers actually show, and then at what they can't show.' This lesson covers how youth crime is measured, what the long-term trends are, the kinds of offences young people commit, and the disparities that run through youth justice systems in both countries.
How youth crime is measured
There is no single count of youth crime. Each source captures a different slice. Police-reported statistics from Statistics Canada's Uniform Crime Reporting Survey count young persons accused, whether they were charged or dealt with in another way, such as by an extrajudicial measure. Court statistics count cases completed in youth courts. Correctional statistics count young people in custody or under community supervision. Self-report surveys ask young people directly what they have done, and victimization surveys ask people what has happened to them.
Each source is shaped by decisions made by people. Police-reported numbers depend on what victims report and what police record. If a police service decides to deal with more incidents informally without recording them, the numbers fall even if behaviour has not changed. If schools start calling police about fights they once handled themselves, the numbers rise. Self-report surveys consistently show that most adolescents admit to some minor offence, such as shoplifting, vandalism or a fight, at some point, which reminds us that the youth who come to police attention are a small and not entirely random fraction of those who offend.
Long-term trends
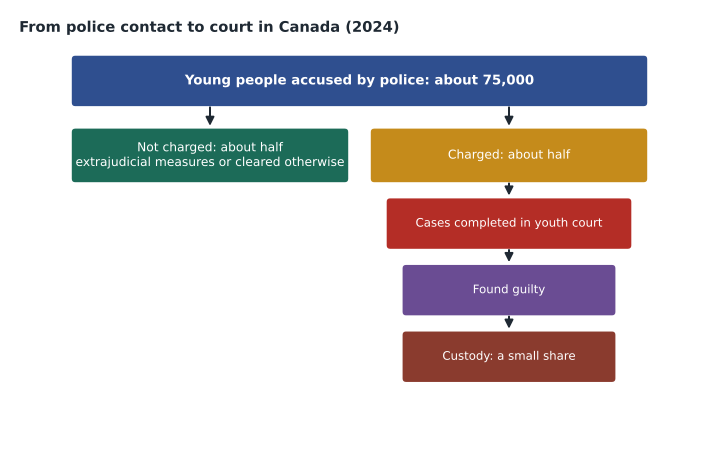
Police-reported youth crime in Canada has fallen substantially since the early 2000s. According to the Department of Justice's overview of youth justice statistics for 2024, the overall youth crime rate was 2,791 young persons accused per 100,000 youth aged 12 to 17, about 4 out of every 100 lower than in 2023 and 13 out of every 100 lower than in 2019. Between 2014 and 2024 the overall youth crime rate fell by about 31 out of every 100, while the youth violent crime rate rose by about 10 out of every 100 over the same period. In 2024, police charged 34,895 young persons, and 40,530 were accused but not charged, most of them dealt with through extrajudicial measures or cleared in other ways.
Bell tells the class to be careful with short-term changes. A single year's increase in one offence, in one city, can be real and important, but it does not reverse a twenty-year trend. And a rate is more informative than a count, because the number of young people in the population changes. Desjardins adds that the fall in youth crime has many proposed causes, and researchers disagree about their relative weight: changes in policing and diversion, reduced lead exposure, changes in drug markets, more time spent online and less unsupervised time on the street, better school programs, and changes in how incidents are recorded.
# Rates per 100,000 let us compare places or years with different populations.
# Port Ardent figures are invented for teaching.
youth_pop = {"2016": 11200, "2021": 11850, "2025": 12400}
accused = {"2016": 512, "2021": 398, "2025": 341}
for yr in youth_pop:
    rate = accused[yr] / youth_pop[yr] * 100000
    print(yr, "rate per 100,000:", round(rate))
change = (accused["2025"] / youth_pop["2025"]) / (accused["2016"] / youth_pop["2016"])
print("2025 rate as a share of 2016 rate:", round(change, 2))2016 rate per 100,000: 4571 2021 rate per 100,000: 3359 2025 rate per 100,000: 2750 2025 rate as a share of 2016 rate: 0.6
In Port Ardent's invented figures, the number of young people accused fell from 512 to 341 while the youth population grew, so the rate fell even faster than the count: the 2025 rate is about 0.6 of the 2016 rate. Bell notes that the same calculation is the first thing he does when a council member says youth crime is 'out of control' in a particular neighbourhood.
What young people are accused of
The offences that bring young people to police attention are mostly the less serious ones. Theft under a modest value, mischief and vandalism, minor assaults, possession of stolen property, breaches of court orders and disturbances make up a large share of youth police contacts in both countries. Serious violence, including robbery, assault with a weapon, sexual offences and homicide, is a small fraction of youth offending, though it receives most of the public attention and rightly most of the system's resources.
Several patterns distinguish youth offending from adult offending. Young people offend in groups much more often than adults; a large share of youth offences involve two or more young people, and peer influence, as lesson 1 explained, is a powerful driver of adolescent risk-taking. Youth offending is concentrated in time and place: after school hours on weekdays, especially between about 3 p.m. and 6 p.m. when young people are unsupervised, and near schools, transit hubs, malls and parks. Many youth victims are other young people. Ben Arsenault and the two teenagers who robbed him all lived within a kilometre of Eastgate Park and had at times attended the same school.
Breaches of court orders, called administration of justice offences, such as failing to comply with a condition of an undertaking, release order or youth sentence, have been a particular concern. A young person released with a long list of conditions, such as a curfew, a requirement to attend school every day and a ban on contact with friends, may breach one of them without committing any new harm, and end up back in custody. Section 28.1 of the YCJA, added in 2019, requires that conditions imposed on a young person's release be reasonable in the circumstances and necessary to address the specific risks of the case, and the Act now encourages alternatives to charging young people for breaches.
Disparities in youth justice
Desjardins turns to the most difficult part of the lesson. In both countries, young people from some groups are much more likely than others to come into contact with police, to be charged rather than diverted, to be detained before trial, and to be placed in custody. Indigenous youth are the clearest example in Canada. According to the Department of Justice, Indigenous youth made up about 40 out of every 100 young people under correctional supervision between 2016/2017 and 2023/2024, about five times their share of the youth population, which is about 8 out of every 100. Black youth are also overrepresented in police contact and custody in several provinces, including Ontario.
Researchers have identified several causes, and they are not mutually exclusive. Some disparities reflect differences in exposure to risk factors that are themselves the product of history and policy, such as poverty, unstable housing, under-resourced schools and, for Indigenous youth, the legacy of residential schools, the child welfare system and the Sixties Scoop. Some reflect where police are deployed: more officers in a neighbourhood means more minor offences come to official attention there. And some reflect decisions at each stage, including whether an officer warns or charges, whether a young person is seen as having a supportive family, and whether a court finds a suitable community placement. Small differences at each decision point can add up to large differences at the end.
The YCJA addresses this directly. Section 3 requires that measures taken against young persons respect gender, ethnic, cultural and linguistic differences and respond to the needs of Aboriginal young persons, and section 38(2)(d) requires the court to consider all available sanctions other than custody, with particular attention to the circumstances of Aboriginal young persons. Police services in Ontario and elsewhere collect race-based data on some kinds of contacts, as students saw in the community policing course, so that disparities can be measured and reduced. Bell gives an example from his own unit. A few years ago Port Ardent reviewed its youth files and found that, for similar first-time shoplifting incidents, white youth were warned more often than Black and Indigenous youth, who were more often referred to a formal program or charged. The difference was partly explained by officers' assumptions about which parents would 'deal with it'. The unit changed its practice so that every first-time minor theft starts with a warning or referral, and officers must write a reason for any departure.
The limits of the numbers
Desjardins closes with a caution. Statistics tell us about patterns, not about the young person in front of us. They can help a service see where its decisions are uneven, where resources are needed, or whether a program is working. But an officer who treats a young person as a statistic, assuming that because they come from a particular neighbourhood or group they are likely to reoffend, commits the very error that produces disparities. Good youth policing uses data to examine the system and judgment, informed by the facts of the case, to deal with the individual.
| Source | What it counts | Main limitation |
|---|---|---|
| Police-reported statistics | Young persons accused, charged or not | Only incidents that come to police attention and are recorded |
| Youth court statistics | Cases completed and their outcomes | Only cases that reach court |
| Custody counts | Young people held on a given day or admitted in a year | Reflect system decisions as much as behaviour |
| Self-report surveys | What young people say they have done | Depend on honesty and memory; may miss serious offenders |
| Victimization surveys | What people say happened to them | Often cannot identify whether the offender was a youth |
Girls, gender and youth offending
Boys make up most young people accused of offences in both countries, and the gap is largest for serious violence. But girls' involvement has its own patterns that officers should understand. Girls who come into contact with police are more likely than boys to have experienced sexual abuse, family violence and running away from home, and some of their offending, such as assaults on family members during conflicts at home, grows directly out of those circumstances. Research has also found that girls have sometimes been held in custody or detention for behaviour, such as breaching curfew or running away, for which boys were less often detained, on the theory that custody would protect them. The YCJA's ban on using detention as a substitute for child protection, mental health or other social measures, in section 29(1), was written partly to stop that practice. Bell's advice is simple: ask what is happening at home, and treat a girl who has run away from home as a possible victim first.
What the numbers miss
Some youth offending is badly measured by every source. Offences that happen online, such as sharing intimate images without consent, threats on social media and online fraud, are underreported, and when they are reported it may be hard to identify the offender's age. Offending within families and among friends is rarely reported to police. And many of the most serious harms to young people, such as sexual exploitation, are offences committed against them by adults, which youth crime statistics do not count at all; lesson 10 returns to this. Desjardins tells the students to treat every number in this lesson as a floor for what happens, not a ceiling, and to remember that an increase in reporting can be good news if it means victims trust police more.
Worked problem
Reading a claim about youth crime
A local news story reports: 'Youth robberies up by half in Eastgate!' The figures behind it show 6 youth robberies in Eastgate in 2024 and 9 in 2025. What questions should an officer ask before drawing conclusions?
Show solution
- The numbers are very small, so a change of three incidents can produce a large-sounding relative change; one active group could explain it.
- Ask about the longer trend: what were the numbers in the previous five years?
- Ask whether anything changed in reporting or recording, such as a new school policy of calling police about phone thefts.
- Ask whether the same young people are involved in several incidents, which would point to a targeted response rather than a general one.
- Compare with nearby neighbourhoods and the city as a whole.
Answer: Small numbers, short time frames and changes in reporting can make a real but local problem look like a trend; the right response depends on the details.
Common mistakes
MistakeYouth crime has been rising for decades.
InsteadPolice-reported youth crime has fallen substantially since the early 2000s, though violent youth crime has risen somewhat since 2014.
MistakeMost youth crime is serious violence.
InsteadMost youth police contacts involve less serious offences such as theft, mischief and minor assaults.
MistakeDisparities simply reflect differences in offending.
InsteadThey reflect a combination of risk factors, where police are deployed and decisions at each stage of the system.
MistakeA large relative increase always means a serious trend.
InsteadWith small numbers, a few incidents can produce a large relative change.
Summary and key terms
- Youth crime is measured by police, court, custody, self-report and victimization data, each with limits.
- Police-reported youth crime fell substantially after the early 2000s; in 2024, about half of young people accused were not charged.
- Young people mostly commit less serious offences, often in groups, after school and near places where young people gather.
- Breaches of release conditions can draw young people deeper into the system without new harm.
- Indigenous youth make up about 40 out of every 100 young people under correctional supervision, about five times their population share.
- Statistics describe the system; individual decisions must be based on the facts of the case.
- Rate per 100,000
- A count divided by the population and multiplied by 100,000, allowing fair comparison.
- Self-report survey
- A survey in which young people report their own offending.
- Administration of justice offence
- An offence such as failing to comply with a court order or release condition.
- Disparity
- A difference between groups in contact with, or outcomes in, the justice system.
- Overrepresentation
- A group making up a larger share of a system population than of the general population.
- Status offence
- Conduct that is an offence only for juveniles, such as truancy or running away (a United States term).
Practice problems
Work each problem on paper first, then reveal the answer to check.
Why is a rate more informative than a count?
Show answer
Because it accounts for changes in the size of the population.
In the code example, what was the 2025 rate as a share of the 2016 rate?
Show answer
About 0.6.
Give two reasons small numbers can mislead.
Show answer
A few incidents can create a big relative change; one group or a reporting change can explain it.
What did Port Ardent change after its review of first-time shoplifting files?
Show answer
Every first-time minor theft starts with a warning or referral, and departures need a written reason.
Lesson quiz · 5 questions
Score 60% or more to complete this lesson.
Create a free account to save your progress, take quizzes and earn a certificate.