
MSAZ-321 · Lesson 8 of 12 · 20 min
The monitoring hub and capacity metrics
▶ Video coming soon A video version of this lesson is on the way.
On the morning of Thursday, November 5, several store managers in the trial group complained that the Sales Overview report was slow, some visuals taking twenty seconds to appear. By nine it had cleared up. The cause, everyone suspected, was the full three-year backfill notebook Ines had run overnight, which MSAZ-320 described. On Friday morning, November 6, Nikolai used the incident to teach the two tools that show what a whole capacity is doing: the Monitor hub and the Microsoft Fabric Capacity Metrics app.
The Monitor hub
The Monitor hub, in preview, is the single place in the Fabric portal to see activity across items and workspaces. Its Job runs page lists one row per job, such as a pipeline, notebook, dataflow, copy job, semantic model refresh or Spark job definition, with a summary of its last five runs. Selecting a row opens its run history and the details of each run, including a pipeline's activities as a table or Gantt chart, with links to open the item or a full detail page. Other pages cover Spark applications, capacity and cost, agents and alerts, where people choose who is notified of job failures.
Everyone can open the Monitor hub, but each person sees only activity for items they have permission to view. Filters narrow the list by time, from the last hour to a number of days, by item type, status and workspace, and a filtered layout can be saved as a view. For a failed pipeline run, an Investigate option, also in preview, starts a read-only investigation by an operations agent that suggests likely causes without changing anything. Ines saved a view called Hub nightly, showing the last 24 hours of pipelines, notebooks and semantic model refreshes in the FDH workspaces, as the first screen of her morning check.
| Monitor hub feature | What it gives | Hub use |
|---|---|---|
| Job runs list | One row per job, last five runs, status | Morning check of the nightly loads |
| Run details and history | Each run's activities, timings and errors | Drill into a failure or a slow run |
| Filters and saved views | Time, item type, status, workspace; saved layouts | The Hub nightly view |
| Applications | Spark applications across workspaces | Find long-running notebooks |
| Alerts | Who is notified of job failures | Data team channel for pipeline failures |
| Investigate (preview) | An agent's read-only analysis of a failed pipeline run | A second opinion on unclear failures |
The Monitor hub showed the backfill notebook as a single long run from 9:10 p.m. on November 4 to 3:40 a.m. on November 5, succeeded. Nothing failed, which is exactly why it did not explain the slow reports. For that, Nikolai opened the capacity metrics app.
Capacity units and timepoints
Every Fabric operation consumes capacity units, measured in capacity-unit seconds, CU-seconds. A capacity provides its number of CUs every second: the trial gave 64 CU, an F16 gives 16. The capacity metrics app reports consumption in timepoints of 30 seconds, so the trial capacity had 64 × 30 = 1,920 CU-seconds to give in each timepoint and an F16 has 480. Operations are classed as interactive, started by a person and expected to answer quickly, such as report queries, or background, such as pipelines, notebook jobs, dataflow refreshes and semantic model refreshes.
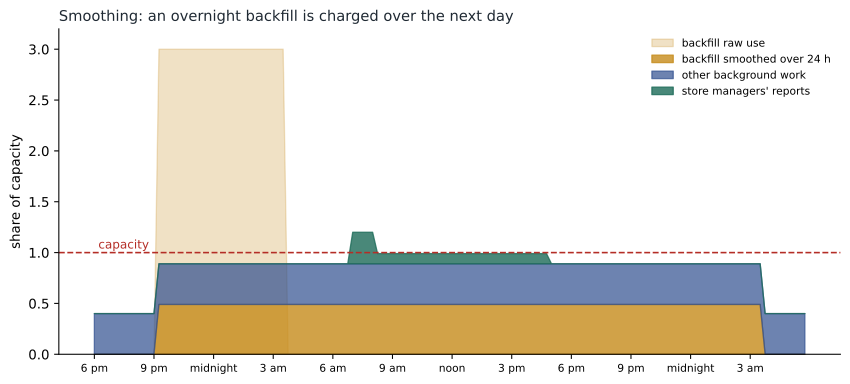
Fabric does not charge an operation's whole cost to the moment it ran. It smooths it: interactive operations are spread over at least five minutes and up to about an hour, and background operations over 24 hours. A notebook that used a lot of capacity for six hours overnight therefore keeps a share of the capacity busy for the next day. Smoothing is what lets a capacity absorb short bursts above its size, and it is also why a heavy overnight job can slow the morning's reports.
Throttling
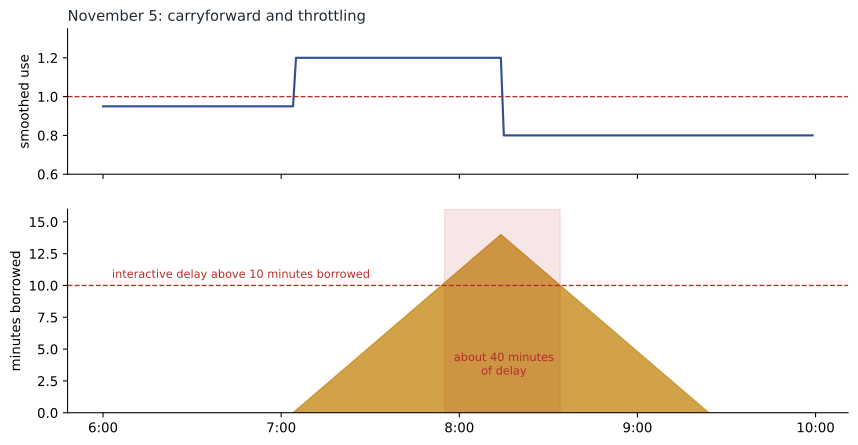
When smoothed use exceeds the capacity, Fabric lets the capacity borrow from the future, and tracks how much is borrowed, in minutes of the whole capacity, as carryforward. Borrowing up to ten minutes is overage protection: nothing is slowed. Beyond that, throttling begins, in stages that protect interactive users first and background jobs last. When more than ten and up to sixty minutes are borrowed, new interactive operations are delayed by about twenty seconds. Beyond sixty minutes and up to twenty-four hours, new interactive operations are rejected. Beyond twenty-four hours, new background operations are rejected too. When use falls below the capacity, the spare capacity pays back the carryforward, which is called burndown, and throttling ends once borrowing drops back below the stage thresholds.
| Future capacity borrowed | Stage | Effect |
|---|---|---|
| Up to 10 minutes | Overage protection | None; bursts are absorbed |
| 10 to 60 minutes | Interactive delay | New interactive operations wait about 20 seconds |
| 60 minutes to 24 hours | Interactive rejection | New interactive operations are rejected |
| Over 24 hours | Background rejection | New background operations are rejected as well |
# Borrowing future capacity on the morning of November 5 (illustrative figures)
use = {}                                  # smoothed use as a share of capacity, per minute
for m in range(6 * 60, 10 * 60):
    if 7 * 60 + 5 <= m < 8 * 60 + 15:
        use[m] = 1.20                     # backfill smoothing plus the morning report rush
    elif m >= 8 * 60 + 15:
        use[m] = 0.80                     # reports settle; spare capacity pays the debt back
    else:
        use[m] = 0.95

def stage(borrowed):
    if borrowed == 0: return "normal"
    if borrowed <= 10: return "overage protection"
    if borrowed <= 60: return "interactive delay"
    if borrowed <= 24 * 60: return "interactive rejection"
    return "background rejection"

borrowed, last, peak = 0.0, None, 0.0
for m in sorted(use):
    borrowed = max(0.0, borrowed + use[m] - 1.0)   # minutes of future capacity borrowed
    peak = max(peak, borrowed)
    s = stage(borrowed)
    if s != last:
        print(f"{m // 60}:{m % 60:02d}  {s:20s} borrowed {borrowed:5.1f} min")
        last = s
print(f"peak borrowed: {peak:.1f} minutes")6:00 normal borrowed 0.0 min 7:05 overage protection borrowed 0.2 min 7:55 interactive delay borrowed 10.2 min 8:34 overage protection borrowed 10.0 min 9:24 normal borrowed 0.0 min peak borrowed: 14.0 minutes
What this code does
The program models four hours of the morning, minute by minute, using the smoothed share of the capacity in use: a little under full until 7:05, then 120 in 100 while the backfill's smoothed cost and the morning reports overlapped, then 80 in 100 once the reports settled. Each minute above full adds to the amount of future capacity borrowed and each minute below pays some back. The program prints the time whenever the throttling stage changes and the peak amount borrowed, showing about 40 minutes of interactive delay.
The model matched what the store managers had seen. Borrowing began at 7:05, crossed ten minutes at 7:55, when reports started to slow, peaked at 14 minutes at 8:15, and fell back below ten at about 8:34, when the slowness stopped. The real figures in the capacity metrics app were noisier, but the shape was the same: the backfill alone had not overloaded the capacity, but its smoothed cost, still being charged the next morning, left too little room for the store managers' reports.
The capacity metrics app
The Microsoft Fabric Capacity Metrics app is a Power BI app that capacity administrators install to see how their capacities are used. Its Compute page shows CU use over the last 14 days, split into interactive and background, with a capacity utilization and throttling chart and a table of items and operations ranked by the CU-seconds they consumed. Its Storage page covers 30 days. The Timepoint pages show, for one 30-second timepoint, every interactive and background operation that contributed to it, which is how to answer the question of who was using the capacity at 8:10 on Thursday. Data appears about 10 to 15 minutes after activity.
Nikolai had installed the app on October 22. On the Compute page, the throttling chart showed interactive delay on the morning of November 5. On the Timepoint detail for 8:10 a.m., the largest background contributor was the backfill notebook, still charging its smoothed share, followed by the nightly pipeline's notebook and the Rewards mirror; the interactive contributors were the Sales Overview queries. Clicking through the items table showed the backfill as the hub's single largest consumer of the fortnight.
| App page | Shows | Question it answers |
|---|---|---|
| Compute | CU use over 14 days, interactive and background, throttling, top items | Is the capacity big enough, and who uses it? |
| Storage | Storage by workspace and item over 30 days | Where is OneLake storage growing? |
| Timepoint and timepoint detail | Every operation contributing to one 30-second timepoint | What was using the capacity at that moment? |
| Health | Overall status of the capacities you administer | Is anything wrong right now? |
The app does not send alerts. For notifications, capacity administrators use Fabric's capacity events, such as capacity overview events, which can feed Activator in the same way job events do, and the admin portal's notification settings for capacity limits. Tenant-wide inventory, activity and governance data, as opposed to capacity consumption, live in the admin monitoring workspace, which Fabric administrators open from the admin portal and whose semantic models refresh daily.
Preventing a repeat
The fix was not to make the trial capacity bigger, but to run heavy one-off work where its cost would not collide with people. Nikolai listed the options. Split the backfill into slices, as MSAZ-320 did with its rerun on November 6 and 7, so each slice's smoothed cost was small. Run large one-off jobs on a Friday evening, so their 24-hour smoothing fell mostly on the weekend. Use surge protection, a capacity setting that limits how much background work can be accepted when the capacity is busy, so that a runaway job is held back before it can push interactive users into throttling. And, for the pilot, consider moving heavy Spark work to Spark autoscale billing, which bills Spark separately as it runs instead of drawing on the shared capacity, if the pilot's measurements showed Spark crowding out reports.
One more habit came out of the incident. Ines added a column to the hub's design table for every scheduled job: its expected CU-seconds per run, taken from the capacity metrics app after the first few runs, and the time window it was allowed to run in. The nightly pipeline, its notebooks and the semantic model refresh together used about 310,000 CU-seconds a night on the trial, about 6 in 100 of the trial capacity's 5.5 million CU-seconds a day. Writing the figure down meant that the next time someone proposed a large job, the first question would be how many CU-seconds, and when.
Worked problem
Would the backfill fit if split?
The full backfill consumed about 2,700,000 CU-seconds. Background use is smoothed over 24 hours, which is 2,880 timepoints. How many CU-seconds per timepoint does it add, as a share of the trial capacity's 1,920? What if it were split into 36 monthly slices, run 6 per evening over six evenings?
Show solution
- Whole backfill: 2,700,000 ÷ 2,880 = 937.5 CU-seconds per timepoint.
- As a share: 937.5 ÷ 1,920 ≈ 0.49, about half of the capacity for a day.
- One evening's 6 slices: 2,700,000 × 6 ÷ 36 = 450,000 CU-seconds.
- Smoothed: 450,000 ÷ 2,880 = 156.25 CU-seconds per timepoint, about 8 in 100 of the capacity.
Answer: Run whole, the backfill took about half the capacity for the following day; split over six evenings, each evening's share was about 8 in 100, which leaves plenty of room for reports.
The 2,700,000 figure came from the items table in the app. The slicing arithmetic persuaded Elena that the problem had been one of scheduling rather than size, and the pilot plan kept the F16 with a rule that any job expected to use more than a quarter of a day's capacity must be sliced or run at a weekend.
Capacity planning for the pilot
Nikolai finished with a habit for the pilot: look at the Compute page every Monday, note the peak smoothed use and the top five items, and compare them with the week before. A capacity that regularly reaches 80 in 100 at its daily peak has no room for growth or for a bad night; one that stays at 30 in 100 may be larger than needed. The capacity metrics app is where those decisions come from, rather than from guesswork.
Common mistakes
MistakeBlame a slow morning on the jobs running that morning.
InsteadBackground work is smoothed over 24 hours; check last night's heavy jobs in the timepoint detail.
MistakeExpect the capacity metrics app to send alerts.
InsteadIt does not; use capacity events with Activator or admin notifications.
MistakeFix throttling by buying a larger capacity first.
InsteadCheck scheduling, slicing and surge protection before resizing.
MistakeRead the Monitor hub as showing everything in the tenant.
InsteadEach user sees only items they have permission to view.
Summary and key terms
- The Monitor hub lists jobs with their last five runs, run details, filters, saved views and alerts.
- Operations consume CU-seconds, reported in 30-second timepoints; interactive work is smoothed over minutes, background over 24 hours.
- Borrowing up to 10 minutes of future capacity is overage protection; beyond that come interactive delay, interactive rejection and background rejection.
- Burndown pays back carryforward when use falls below the capacity.
- The capacity metrics app shows 14 days of compute, 30 days of storage and timepoint detail, with data 10 to 15 minutes behind.
- Prevent throttling by slicing and scheduling heavy jobs, surge protection and, where needed, separate Spark billing.
- Monitor hub
- The Fabric page that lists job runs and their details across workspaces.
- Capacity unit (CU)
- The unit of Fabric compute a capacity provides each second.
- Timepoint
- A 30-second interval in which the capacity metrics app reports consumption.
- Smoothing
- Spreading an operation's consumption over time, 24 hours for background work.
- Carryforward
- Future capacity borrowed when smoothed use exceeds the capacity.
- Burndown
- Paying back carryforward with spare capacity.
- Surge protection
- A capacity setting that limits background work when the capacity is busy.
Practice problems
Work each problem on paper first, then reveal the answer to check.
How many CU-seconds does an F16 provide in one timepoint?
Show answer
16 × 30 = 480.
Why did an overnight notebook slow the morning's reports?
Show answer
Its background cost was smoothed over the next 24 hours and combined with the report rush.
At what amount of borrowed capacity does interactive delay begin?
Show answer
More than 10 minutes.
Where can you see every operation contributing to one 30-second interval?
Show answer
The timepoint detail pages of the capacity metrics app.
Name two ways to prevent a repeat without buying a larger capacity.
Show answer
Slice and schedule heavy jobs, and use surge protection.
Lesson quiz · 5 questions
Score 60% or more to complete this lesson.
Create a free account to save your progress, take quizzes and earn a certificate.