
MSAZ-321 · Lesson 7 of 12 · 21 min
Monitoring pipelines and notebooks
▶ Video coming soon A video version of this lesson is on the way.
This session went back in time to Friday, October 30, the end of the hub's first week of nightly runs in FDH Sales [Dev]. pl_nightly_sales had run at 1 a.m. on four nights, and Nikolai wanted Ines to know, before anything went seriously wrong, exactly where to look when it did. His opening line was that monitoring is not looking at a page of green ticks; it is knowing what normal looks like, so that abnormal stands out.
What a pipeline run records
Every pipeline run is recorded with its status, start time, duration, trigger, whether scheduled, manual or event-based, and the parameter values it ran with. Inside each run, every activity run is recorded too, with its own status, duration, input, output and, for failures, the error code and message. In the pipeline's run history, selecting a run opens its activity runs as a table or as a Gantt chart, a timeline that shows each activity as a bar, which makes it obvious which activities ran in parallel and which one held up the rest.
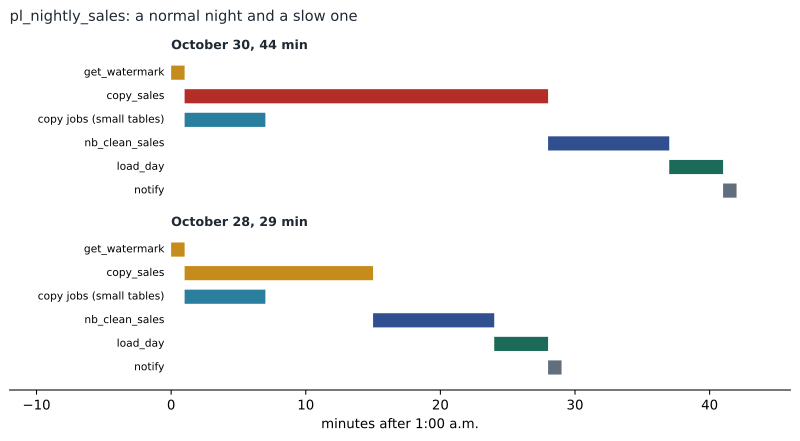
The four nights were not all alike. October 27 and 28 took 31 and 29 minutes. October 29 failed at 1:12 a.m., which lesson 11 investigates; Ines reran it manually at 8:20 and it took 30 minutes. October 30 succeeded but took 44 minutes. Ines opened the October 30 run's Gantt view and saw at once that copy_sales, normally about 14 minutes, had taken 27, and that everything after it had simply waited.
Reading a copy activity
A copy activity's output is a small report: rows read and written, data read and written, throughput, the number of parallel copies used, and a breakdown of the duration into queuing time, time to first byte from the source and transfer time. The October 30 copy had read the same 38,000 rows as usual, so the volume had not changed. Its time to first byte, though, was over twelve minutes instead of the usual few seconds: the source had been slow to start returning data. That pointed away from Fabric and toward StockLine.
| Copy output | Usual night | October 30 | What it suggests |
|---|---|---|---|
| Rows read | About 38,000 | 38,412 | Volume normal |
| Time to first byte | About 5 seconds | 12 minutes 40 seconds | Source slow to respond |
| Transfer time | About 13 minutes | About 14 minutes | Transfer itself normal |
| Throughput | Steady | Steady once started | No network problem |
| Parallel copies | 4 | 4 | Configuration unchanged |
Walt Hadley, the database administrator, confirmed it within minutes of Ines's message: StockLine's weekly index maintenance ran from 1 a.m. to about 1:15 every Thursday night, and the copy's first query had waited behind it. He moved the maintenance to 3 a.m. The lesson for Ines was the order of questions: what took longer, which part of it, and what was different that night. The run history answered the first two; a conversation answered the third.
Notebook and Spark monitoring
Notebooks need different tools, because the interesting detail is inside Spark. When a pipeline runs a notebook, the activity run links to a snapshot of the notebook as it ran, with every cell's output, which is the first place to look after a failure. Each notebook run is also a Spark application, and the Spark application detail page shows its jobs, stages and tasks, the resources it used over time, its logs and links to the Spark UI and history server. The Monitor hub, covered in the next lesson, lists these applications alongside pipelines.
| Where | Shows | Use it to |
|---|---|---|
| Notebook snapshot from a pipeline run | The notebook with each cell's output as it ran | See which cell failed and its error |
| Spark application detail page | Jobs, stages, duration, resource use, logs | See where time went in a slow run |
| Spark UI and history server | Stage and task metrics, including skew | Find stages where a few tasks take far longer |
| Spark advisor in the notebook | Live hints in cell output, such as fallbacks from the native engine | Catch performance problems while developing |
| Resource usage view | Executors and cores in use over time | See whether the session was too large or too small |
Ines opened nb_clean_sales from the October 28 run. Its nine minutes broke down into about two and a half minutes of session start-up, because the notebook used a custom environment, five minutes of the deduplication and cleaning stage and a minute and a half writing to Delta. Nikolai asked her to note the start-up time, because lesson 10 would show how to shorten it.
Dataflows and semantic models
Dataflow Gen2 keeps a refresh history with the status and duration of each refresh and, within it, each table's or query's status, so a failure can be traced to the query that caused it. Semantic models keep a refresh history too, showing scheduled and on-demand refreshes, their duration and any error; DP-700 lists monitoring semantic model refresh as a skill because a data engineer's load is not finished until the model that reports read has refreshed. On the trial, Sales Overview refreshed at 2:30 a.m., after the nightly pipeline, and Ines checked that its refresh history matched: four refreshes, all after the pipeline had finished, the October 29 one failing because the pipeline had not run.
A load log of your own
Built-in history answers what happened to a run. It does not answer what happened to the data: how many rows each step loaded, how many were rejected, or whether the totals reconciled. MSAZ-320 had added a load_log table in lh_curated that every step wrote to, with the run id, step, rows in, rows out, rows rejected and the watermark used. Monitoring it was a matter of a query and a habit: each morning, compare last night with what normal looks like.
# Flag activities that took much longer than their usual time
from statistics import median
runs = {   # activity minutes per night, from the run history
    "Oct 27": {"copy_sales": 15, "nb_clean_sales": 10, "load_day": 4},
    "Oct 28": {"copy_sales": 14, "nb_clean_sales": 9,  "load_day": 4},
    "Oct 29": {"copy_sales": 14, "nb_clean_sales": 9,  "load_day": 5},   # the 8:20 rerun
    "Oct 30": {"copy_sales": 27, "nb_clean_sales": 9,  "load_day": 4},
}
activities = runs["Oct 27"].keys()
usual = {a: median(r[a] for r in runs.values()) for a in activities}
print("usual:", ", ".join(f"{a} {m:g} min" for a, m in usual.items()))
for night, r in runs.items():
    slow = [f"{a} {r[a]} min ({r[a] / usual[a]:.1f}x)" for a in activities if r[a] > 1.5 * usual[a]]
    total = sum(r.values())
print(f"{night}: activity total {total} min", "- slow: " + ", ".join(slow) if slow else "- normal")usual: copy_sales 14.5 min, nb_clean_sales 9 min, load_day 4 min Oct 27: activity total 29 min - normal Oct 28: activity total 27 min - normal Oct 29: activity total 28 min - normal Oct 30: activity total 40 min - slow: copy_sales 27 min (1.9x)
What this code does
The program holds the minutes each main activity took on the first four nights, works out the usual time for each activity as the middle value of the four nights, and then checks each night for activities that took more than one and a half times as long as usual. The output lists the usual times and then each night with the total of the three activities and any slow activity named, showing that only October 30 stood out, because copy_sales took about twice its usual time.
The median is a better yardstick than the average for this, because one bad night does not drag it up, and 1.5 times usual is a simple threshold that ignores normal wobble. Nikolai said the same check would run as a small notebook after each night's load, writing its findings to the load log, once the hub had a few more weeks of history. The totals in the output are the three main activities only; the whole pipeline also includes the parallel copy jobs and a minute or two of short steps.
Workspace monitoring
For a broader view, Fabric offers workspace monitoring, in preview. Turning it on creates a monitoring item in the workspace containing an eventhouse with a KQL database that receives logs and metrics from the workspace's items: among others, pipelines, Dataflow Gen2, copy jobs, semantic models, warehouses, mirrored databases, eventhouses, eventstreams and Real-Time dashboards. The data is kept for 30 days by default, and the retention can be changed on the monitoring database. Workspace users with at least the Contributor role can query it with KQL, and it uses the workspace's capacity like any eventhouse.
A few rules shape how it is used. Only one monitoring item can collect telemetry for a workspace, and several workspaces can send to one central monitoring eventhouse if they are in the same region. Collection starts when it is turned on, with no backfill of earlier activity, and a table appears only once an item has produced telemetry for it. When the capacity is throttled, ingestion into the monitoring eventhouse and queries on it keep running, so monitoring still works during the incidents it exists to explain. Nikolai turned it on for FDH Sales [Dev] and FDH Stores [Dev] that morning, sending both to one monitoring eventhouse, so that the hub's engineers could query every run in KQL, the language Ines had just started to learn.
// From the workspace monitoring database: last week's pipeline runs and their durations
// (table and column names depend on the items and the current schema; check the database first)
ItemJobEventLogs
| where Timestamp > ago(7d) and ItemKind == "Pipeline"
| summarize Runs = count(), Failed = countif(JobStatus == "Failed"),
            AvgMinutes = avg(DurationMs) / 60000.0 by ItemName
| sort by Failed desc
Rerunning a failed run
Monitoring often ends in a rerun, and a rerun is only safe if the load is idempotent, which MSAZ-320 built in: the warehouse procedure deletes a day's facts before inserting them, and the watermark moves only after a checked copy. The run history offers to rerun a pipeline with the same parameters, and the run details offer options to rerun from the activity that failed, so that steps which already succeeded are not repeated. Ines used a full rerun on October 29, because the failure had happened in the first copy and nothing downstream had run. Nikolai's rule was to read the failed run's error before pressing rerun, every time: a rerun fixes a passing problem, such as a gateway that was briefly offline, and wastes capacity on a lasting one, such as an expired credential.
Worked problem
Is a slow night worth an investigation?
Over ten nights, copy_sales took 14, 15, 14, 13, 14, 27, 14, 15, 14 and 16 minutes. Using the rule slower than 1.5 times the median, which nights are flagged?
Show solution
- Sort the values: 13, 14, 14, 14, 14, 14, 15, 15, 16, 27.
- The median of ten values is the average of the fifth and sixth: (14 + 14) ÷ 2 = 14.
- Threshold: 1.5 × 14 = 21 minutes.
- Only the 27-minute night exceeds 21; 16 minutes is normal variation.
Answer: One night is flagged, the 27-minute one; the others are within normal variation.
What to watch, and how often
By the end of the session Ines had a monitoring routine. Each morning, before the store managers' 8 a.m. opening, someone checks that last night's pipeline succeeded, that its duration and row counts are normal, and that Sales Overview refreshed after it. Failures do not wait for the morning: the Teams failure branch from MSAZ-320 and the job-event rule from lesson 5 send them as they happen. Weekly, the team reviews trends in the load log and the capacity metrics app. And after any incident, the run history, the notebook snapshot and the copy output are saved to the incident note before they age out.
| When | Check | Where |
|---|---|---|
| As it happens | Pipeline failures | Teams message from the failure branch and the job-event rule |
| Each morning | Last night's status, duration, rows and model refresh | Run history, load_log, refresh history |
| Weekly | Duration trends and capacity use | load_log query, workspace monitoring, capacity metrics app |
| After an incident | Save the evidence | Run details, notebook snapshot, copy output |
Common mistakes
MistakeJudge a run only by its status.
InsteadCompare duration and row counts with what is normal for that run.
MistakeLook at the pipeline's total duration only.
InsteadUse the Gantt view and activity outputs to find which part took longer.
MistakeStop monitoring when the pipeline succeeds.
InsteadCheck that the semantic model refreshed after the load, too.
MistakeExpect workspace monitoring to show last month.
InsteadIt collects only from when it is turned on, with no backfill.
Summary and key terms
- Pipeline runs record status, duration, trigger and parameters; activity runs record inputs, outputs and errors, viewable as a Gantt chart.
- Copy activity output breaks duration into queuing, time to first byte and transfer, which separates source problems from Fabric problems.
- Notebook snapshots, the Spark application page, the Spark UI and the Spark advisor monitor notebooks.
- Dataflow and semantic model refresh histories complete the picture of a load.
- A custom load log and a median-based check show when the data, not just the run, is abnormal.
- Workspace monitoring, in preview, sends item logs to a KQL database kept 30 days by default.
- Activity run
- The record of one activity within a pipeline run, with its input, output and status.
- Gantt view
- A timeline of a pipeline run showing each activity as a bar.
- Time to first byte
- How long a source takes to begin returning data in a copy.
- Notebook snapshot
- The copy of a notebook, with outputs, saved for a run started by a pipeline.
- Workspace monitoring
- A feature that sends a workspace's item logs and metrics to a KQL database.
- Load log
- A table the loads write to, recording rows in, out and rejected for each step.
Practice problems
Work each problem on paper first, then reveal the answer to check.
Where did Ines see that copy_sales was the slow activity?
Show answer
In the Gantt view of the run's activity runs.
What did the long time to first byte suggest?
Show answer
The source was slow to start returning data, which pointed to StockLine.
Why use the median rather than the average as the usual time?
Show answer
One bad night does not drag the median up.
What does workspace monitoring create?
Show answer
A monitoring item with an eventhouse and KQL database that receives item logs.
Why check the semantic model's refresh history after the pipeline?
Show answer
The load is not finished until the model that reports read has refreshed.
Lesson quiz · 5 questions
Score 60% or more to complete this lesson.
Create a free account to save your progress, take quizzes and earn a certificate.