
MSAZ-321 · Lesson 4 of 12 · 21 min
Real-time dashboards
▶ Video coming soon A video version of this lesson is on the way.
On Monday morning, November 9, Ines built the screen the Brandon store manager had asked for. The live stream would start the next day, so she built the dashboard on the October archive and the latest_reading view, planning to switch nothing at all when the stream arrived: the same tables would simply start filling with live data. The store's back office had a wall-mounted television that showed the staff rota; facilities would add a second screen beside it for the freezers.
What a Real-Time dashboard is
A Real-Time dashboard is a Fabric item in Real-Time Intelligence that shows a collection of tiles, each backed by a KQL query and drawn as one visual. Tiles can be arranged on pages, and the whole dashboard shares parameters, such as a time range, that tiles pick up in their queries. Because each tile is a KQL query against an eventhouse, which answers time-based questions in seconds, the dashboard can refresh as new data arrives without waiting for a semantic model to refresh, which is the main difference from a typical Power BI report.
A dashboard connects to data through data sources: reusable references to a database that tiles can share. The supported source types are an eventhouse or KQL database, Azure Data Explorer, Azure Monitor and, in newer releases, an ontology. Different tiles can use different sources, so one dashboard can combine freezer readings from eh_sensors with, for example, capacity data from another database.
Designing tiles
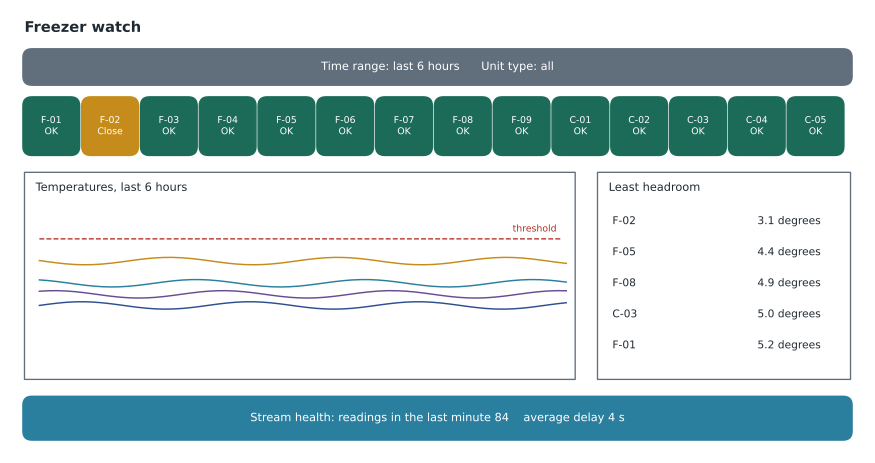
Ines sketched the screen before writing any query, asking what the person looking at it needed to decide. A store manager walking past needed to know at a glance whether anything was wrong, so the top row became 14 stat tiles, one per unit, coloured by status. A facilities technician investigating needed the shape of the last few hours, so the middle became a time chart. And the facilities lead needed to know which units were drifting, so a small table listed the units with least headroom. A final tile showed the health of the data itself: how many readings had arrived in the last minute and the average delay.
| Tile | Visual | Query source | Question it answers |
|---|---|---|---|
| Unit status | Stat tiles with colour rules | latest_reading view | Is any unit above its threshold right now? |
| Last hours | Time chart | readings_clean, 1-minute bins | How have temperatures moved? |
| Least headroom | Table | readings_clean, 10-minute bins | Which units came closest to trouble? |
| Stream health | Multi-stat | readings_clean, last minute | Is data still arriving, and how late? |
Each visual has its own settings. Stat tiles show one value; multi-stat tiles show several. Time charts, line, bar, column, area and pie charts work as in any reporting tool, and an anomaly chart draws the output of series_decompose_anomalies. Tables can carry conditional formatting, so a cell turns amber or red when a value crosses a rule. Ines used rules on the status tiles: green while the temperature was at least 3 degrees below the threshold, amber within 3 degrees, red above it.
// Unit status tile: one row per unit from the materialized view
latest_reading
| lookup units on UnitId
| where UnitType in (_unitTypes)
| extend Headroom = Threshold - TemperatureC,
         Status = case(TemperatureC > Threshold, "Above",
                       Threshold - TemperatureC < 3, "Close",
                       "OK")
| project UnitId, TemperatureC, Status, ReadingTime
Parameters
Parameters make one dashboard serve several needs. Every new dashboard has a time range parameter whose values arrive in queries as _startTime and _endTime; a tile uses them by filtering on them, and a tile that does not mention them ignores the time picker entirely. Custom parameters can be single or multiple selection, with fixed values or values from a query, and a default. Ines added _unitTypes, a multi-select of freezer and cooler, so facilities could look at freezers alone. Using parameters in the where clause, rather than filtering afterwards, also helps performance, because the filter applies as early as possible.
// Time chart tile: picks up the dashboard time range
readings_clean
| where ReadingTime between (_startTime .. _endTime)
| lookup units on UnitId
| where UnitType in (_unitTypes)
| summarize AvgTemp = avg(TemperatureC) by UnitId, bin(ReadingTime, 1m)
| render timechart
Base queries reduce repetition. A base query is a named query fragment defined once in the dashboard and referenced by tiles, so the filter on time, unit type and joined reference data is written in one place. When the facilities team later asked for a parameter for store, ready for the day other stores had sensors, Ines changed the base query and every tile followed.
Refresh and its cost
Live refresh updates visuals as new data is ingested, and the dashboard's settings cap how often tiles may refresh, with a fixed interval for visuals that cannot refresh live. The owner sets a default interval for viewers and a minimum below which viewers cannot go. Every refresh runs every tile's query, so a dashboard on a wall screen, refreshing all day, is a steady source of queries against the eventhouse. Nikolai made Ines work out the load before choosing the interval.
# Queries a wall-screen dashboard runs in a day, and rows scanned
tiles = 4
screens = 2                      # the back-office screen and one facilities laptop left open
seconds_per_day = 24 * 3600
rows_per_day = 14 * 8640         # readings arriving each day

for interval_s in (10, 30, 60, 300):
    refreshes = seconds_per_day // interval_s
    queries = refreshes * tiles * screens
    print(f"every {interval_s:>3} s: {refreshes:>5,} refreshes, {queries:>7,} queries a day")

# The status tile: scanning six hours of readings versus reading the materialized view
six_hours = rows_per_day // 4
print(f"status tile scanning 6 hours: {six_hours:,} rows per query")
print("status tile on latest_reading: 14 rows per query")every 10 s: 8,640 refreshes, 69,120 queries a day every 30 s: 2,880 refreshes, 23,040 queries a day every 60 s: 1,440 refreshes, 11,520 queries a day every 300 s: 288 refreshes, 2,304 queries a day status tile scanning 6 hours: 30,240 rows per query status tile on latest_reading: 14 rows per query
What this code does
The program counts how many times a dashboard with four tiles, open on two screens, would run its queries in a day at four different refresh intervals. It then compares how many rows the unit-status tile must read if it scans six hours of raw readings with how many it reads from the materialized view of latest readings. The output shows refresh load falling sharply as the interval grows, and the view cutting each status query from tens of thousands of rows to 14.
At ten seconds, the two screens would run about 69,000 queries a day; at thirty seconds, 23,040; at a minute, 11,520. The temperatures themselves change slowly, and the alert, not the screen, was the safety mechanism, so Ines chose a thirty-second minimum. Pointing the status tile at the materialized view mattered more than the interval: each refresh read 14 rows instead of about 30,000. A good rule for wall screens is that the heaviest tiles should read views or small aggregates, never raw history.
Designing for a screen nobody stares at
A wall screen is read in a glance by people doing something else, so its design rules differ from a report's. Ines followed four. First, one question per screen: is anything wrong with the freezers? Every tile on the first page served that question, and investigation tiles went to a second page. Second, status before detail: the stat tiles at the top carried the answer, and the chart below explained it. Third, never rely on colour alone, because about one man in twelve has some form of colour vision deficiency; each status tile showed the word OK, Close or Above as well as its colour. Fourth, show when the data last changed, because a frozen screen looks exactly like a calm one; the stream health tile and each unit's reading age made a stalled feed obvious.
She also checked the screen from across the room. Values that were readable on her laptop were too small on the television, so she cut the time chart to the last six hours and made the stat tiles larger, accepting that a technician who needed a week of history would use the second page or the queryset instead.
| Rule | Why | On Freezer watch |
|---|---|---|
| One question per page | Glance reading needs a single message | Page 1: is anything wrong? Page 2: investigate |
| Status before detail | The answer should be visible first | Stat tiles above the time chart |
| Words as well as colour | Colour vision differs between people | OK, Close and Above on every tile |
| Show data freshness | A stalled feed looks like a calm one | Reading age and stream health tile |
Worked problem
Choosing a refresh interval
Four tiles, two screens, refreshing every 30 seconds. How many queries run per day, and how many per hour on the eventhouse?
Show solution
- Refreshes per day: 86,400 ÷ 30 = 2,880.
- Queries per day: 2,880 × 4 tiles × 2 screens = 23,040.
- Per hour: 23,040 ÷ 24 = 960.
Answer: 23,040 queries a day, 960 an hour: modest for an eventhouse when the heavy tiles read a materialized view.
Sharing and permissions
A Real-Time dashboard is shared like other Fabric items, by workspace role or by sharing the item, and the whole dashboard or a single visual can be shared by link, email or Teams. A viewer also needs permission to read the underlying data source, because tiles run their queries as the viewer. For the store screen, facilities created a dedicated account for the television's browser with Viewer access to the dashboard and to eh_sensors, and nothing else, so a passer-by could not open the rest of the workspace from the screen. Dashboards and their metadata are encrypted at rest with Microsoft-managed keys.
Dashboards can be exported as JSON and imported elsewhere, and they are supported in Git integration and deployment pipelines like other items, so Freezer watch would travel from FDH Stores [Dev] to Test and Prod with the rest of the pilot. Tiles can also be created from a KQL queryset with Save to dashboard, as Ines did with her latest-state query in lesson 3, and a Copilot option, in preview, drafts a tile's query from a description in plain language, which the author then checks.
Real-Time dashboard or Power BI?
The hub already used Power BI for the store sales reports, and Ines asked why not use it here too. Nikolai's answer turned on freshness and audience. Power BI reports are the right tool for curated business reporting, with semantic models, measures, row-level security and wide distribution through apps. They can query an eventhouse with DirectQuery for fresher data, and Direct Lake can read the OneLake copy of KQL tables. Real-Time dashboards are the right tool for operational screens over streaming data, written directly in KQL, refreshing in seconds, built quickly by the engineers who own the data.
| Consideration | Real-Time dashboard | Power BI report |
|---|---|---|
| Typical freshness | Seconds, live refresh | Scheduled refresh, or DirectQuery for fresher data |
| Built with | KQL queries per tile | A semantic model with measures and visuals |
| Best audience | Operations staff watching live data | Business users across the company |
| Data sources | Eventhouse, Azure Data Explorer, Azure Monitor, ontology | Almost any source |
| Row-level security in the model | Not part of the dashboard; rely on data permissions | Yes, in the semantic model |
| Hub use | Freezer watch on the store screen | Store sales and the monthly freezer report |
The facilities team's monthly report, showing each unit's performance and incidents, would be a Power BI report on the hourly lakehouse table, because it was business reporting for people who would never open a KQL tile. The wall screen was operations. Both drew on the same readings.
Testing the screen on the archive
Ines set the time range to the night of October 17 and watched F-06's tile turn amber at about 2:45 a.m., when its latest reading came within 3 degrees of the threshold, and red at 3:40, when single readings crossed minus 12. The time chart showed the steady climb from 1:35. Elena, looking over her shoulder, said the screen would have made the problem obvious to anyone who walked into the back office, but at 3:40 a.m. nobody would. That was the case for Activator, the next session's topic: the dashboard shows, the alert tells.
Common mistakes
MistakeRefresh a wall screen as often as possible.
InsteadChoose the slowest refresh that serves the screen's purpose and let alerts handle urgency.
MistakeScan raw history in a tile that refreshes all day.
InsteadPoint frequently refreshed tiles at materialized views or small aggregates.
MistakeExpect the time picker to affect a tile automatically.
InsteadA tile uses the time range only if its query filters on _startTime and _endTime.
MistakeShare the dashboard and forget the data.
InsteadViewers also need read permission on the data source.
Summary and key terms
- A Real-Time dashboard is a set of tiles, each a KQL query drawn as one visual, refreshing as data arrives.
- Data sources are eventhouses or KQL databases, Azure Data Explorer, Azure Monitor and ontologies.
- Parameters, including the built-in time range, and base queries make dashboards flexible and consistent.
- Refresh intervals multiply query load; heavy tiles should read materialized views.
- Viewers need permission on the dashboard and on the data; dashboards support Git and deployment pipelines.
- Use Real-Time dashboards for operational screens and Power BI for curated business reporting.
- Real-Time dashboard
- A Fabric item of KQL-backed tiles that refresh as data arrives.
- Tile
- One query and one visual on a Real-Time dashboard.
- Data source (dashboard)
- A reusable reference to a database that tiles query.
- Parameter
- A dashboard-wide value, such as a time range, that tiles use in their queries.
- Base query
- A named query fragment defined once and reused by several tiles.
- Live refresh
- Updating tiles as new data is ingested, within limits the owner sets.
Practice problems
Work each problem on paper first, then reveal the answer to check.
What backs each tile on a Real-Time dashboard?
Show answer
A KQL query, drawn as one visual.
How does a tile use the dashboard's time range?
Show answer
By filtering on _startTime and _endTime in its query.
Why did the status tile read the materialized view?
Show answer
It refreshes all day, and the view returns 14 rows instead of tens of thousands.
What permission does a dashboard viewer need besides access to the dashboard?
Show answer
Read access to the data source the tiles query.
When is Power BI the better choice?
Show answer
For curated business reporting with semantic models and wide distribution.
Lesson quiz · 5 questions
Score 60% or more to complete this lesson.
Create a free account to save your progress, take quizzes and earn a certificate.