
MSAZ-321 · Lesson 12 of 12 · 20 min
A real-time case study
▶ Video coming soon A video version of this lesson is on the way.
At half past three today, Friday, November 13, Ines presented the freezer pilot design to Elena Brandt, with Nikolai, the facilities lead Dana Whitehorse and Walt Hadley in the room. The trial capacity would expire on December 18, and the pilot would start on the F16 on January 4, 2027, so this was the last chance to change the design cheaply. Elena's instruction had been to present it as a case study: the problem, the design, the evidence, the costs, the risks and the plan, and to say plainly what was still unknown.
The problem and the requirements
The problem was the one from lesson 1. On October 17, freezer F-06 at Brandon failed overnight and was found at 7:40 a.m., and about 3,900 dollars of stock was discarded. Ines restated the requirements as numbers, because a design review argues best about numbers.
| Requirement | Target | Source |
|---|---|---|
| Alert the on-call technician when a freezer or cooler warms | Within 10 minutes of a sustained rise | Facilities |
| No false alarms from normal defrost cycles | None in two weeks of live data | Facilities |
| Notice if the stream itself stops | Within 5 minutes | Data team |
| Back-office screen of every unit | Data no older than about a minute | Store manager |
| History for trends and insurance | 400 days of every reading; hourly summaries kept long term | Facilities and finance |
| Cost on the pilot capacity | Leave room for the nightly loads and reports | Elena |
The design
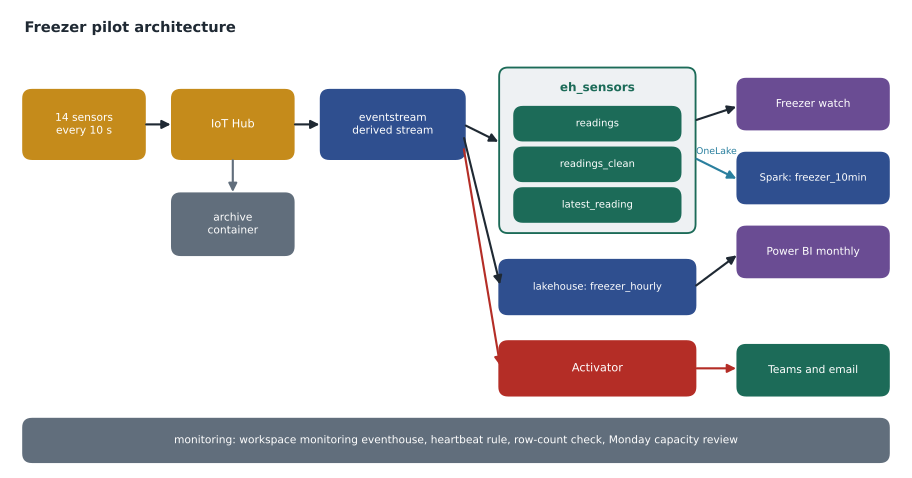
The design used each part of Real-Time Intelligence for the job it does best, as the earlier sessions had established. Sensors send readings every ten seconds to the IoT Hub, which also keeps routing raw messages to the archive container as a safety net. The eventstream ingests from the IoT Hub, renames and converts fields, filters impossible values and publishes a derived stream. From there, readings go to the eh_sensors eventhouse for second-level queries; hourly summaries go to the lakehouse; Activator watches the derived stream for warm units, silent sensors and low batteries. In the eventhouse, an update policy fills readings_clean, a materialized view keeps each unit's latest reading, and OneLake availability shares readings_clean with Spark and Power BI. The Freezer watch dashboard reads the view and the clean table. A scheduled structured streaming job with an available-now trigger writes ten-minute statistics every 15 minutes.
The evidence
Ines presented what the trial had shown, separating measurements from assumptions. The October archive, loaded into the eventhouse, showed F-06's ten-minute average first exceeding minus 12 in the window starting 3:40 a.m. The two-window rule would have alerted at 4:00 a.m. and put a technician in the store at about 4:50, 2 hours 50 minutes before the shift found it. Previewing the rule against the live data from November 10 to 13 found no defrost false alarms, though two weeks of live data, the requirement, would not exist until November 24. The end-to-end test with cooler C-05's probe in water delivered the alert 20 minutes after the probe went in, two windows, as designed. The live stream's ingestion delay averaged about four seconds.
| Claim | Evidence | Type |
|---|---|---|
| An alert would have given about three hours' warning on October 17 | October archive and the fitted model | Measured from history |
| The rule ignores defrost cycles | Rule preview, November 10 to 13 | Measured, but only four days |
| Alerts reach the on-call channel | C-05 probe test, November 12 | Measured once |
| Data reaches the screen in seconds | Average ingestion delay about 4 seconds | Measured on the trial |
| The pilot fits in the F16 | Estimates below | Partly assumed |
The cost
Elena's main question was whether the freezer pilot would crowd the F16, which also had to run the nightly loads and serve 140 report readers. Ines brought an estimate in CU-seconds per day, using the trial's capacity metrics where she had them and marked assumptions where she did not.
# Will the pilot fit on an F16? CU-seconds per day (trial measurements and estimates)
f16_per_day = 16 * 86400
always_on = {"eventstream": 0.9, "eventhouse": 1.4, "activator": 0.2, "workspace monitoring": 0.3}   # average CU
daily = {name: cu * 86400 for name, cu in always_on.items()}
daily["ten-minute stats job"] = 96 * 90 * 4              # 96 runs of 90 s at 4 CU
daily["dashboard queries"] = 23_040 * 2                 # 23,040 queries at about 2 CU-seconds each
daily["nightly loads and model refresh"] = 310_000       # measured on the trial
daily["store manager reports"] = 260_000                 # estimated from trial reports

total = sum(daily.values())
for name, v in sorted(daily.items(), key=lambda kv: -kv[1]):
    print(f"{name:32s} {v:>9,.0f} CU-s  {v / f16_per_day * 100:5.1f} in 100")
print(f"{'total':32s} {total:>9,.0f} CU-s  {total / f16_per_day * 100:5.1f} in 100 of an F16 day")
freezer = sum(daily[k] for k in ("eventstream", "eventhouse", "activator", "ten-minute stats job", "dashboard queries"))
print(f"freezer pilot alone: {freezer / f16_per_day * 100:.1f} in 100")nightly loads and model refresh 310,000 CU-s 22.4 in 100 store manager reports 260,000 CU-s 18.8 in 100 eventhouse 120,960 CU-s 8.8 in 100 eventstream 77,760 CU-s 5.6 in 100 dashboard queries 46,080 CU-s 3.3 in 100 ten-minute stats job 34,560 CU-s 2.5 in 100 workspace monitoring 25,920 CU-s 1.9 in 100 activator 17,280 CU-s 1.2 in 100 total 892,560 CU-s 64.6 in 100 of an F16 day freezer pilot alone: 21.5 in 100
What this code does
The program estimates how many capacity-unit seconds each part of the hub would use in a day on the pilot capacity: the always-on real-time items from their average capacity units, the scheduled statistics job from its runs, the dashboard from its query count, and the nightly loads and reports from the trial's figures. It lists each item's daily use and its share of an F16's daily capacity, largest first, then the total and the share taken by the freezer pilot alone. The output shows the whole hub using a little under two-thirds of the F16 on an average day, with the freezer pilot about a fifth.
The total came to about 65 in 100 of the F16's daily capacity, with the freezer pilot itself about 22 in 100. Two cautions went with it. An average day hides peaks: the morning reports and the overnight loads concentrate use, which is what smoothing absorbs and what throttling punishes, so the peak smoothed use would need watching every Monday, as lesson 8 recommended. And the always-on figures were averages over three days of live data, too few to trust fully. Elena accepted the budget on condition that the team set a review threshold: if peak smoothed use passed 80 in 100 in any week, the team would either move the dashboard queries to longer intervals, schedule the statistics job hourly, or bring forward the decision on an F32.
Questions from the room
Walt asked why the eventhouse and the lakehouse both held freezer data. Ines answered with the readers: facilities technicians investigating an incident needed every reading, queried in seconds, which is what the eventhouse is for; the finance team's insurance records and the monthly Power BI report needed hourly figures for years, which a Delta table holds cheaply and which every Fabric engine can read. OneLake availability meant the detailed readings were also reachable from Spark when someone needed them, without a second copy to maintain. Dana asked what would happen to the alerts if the capacity were throttled. Nikolai explained that Activator respects the capacity's state, so a severely throttled capacity could delay alerts, which was one more reason for the 80 in 100 review threshold and for keeping heavy one-off jobs away from the pilot's capacity. Elena asked the last question, the one she always asked: what would make them stop the pilot? Ines's answer was two false alarms in a week that facilities judged avoidable, or a missed real failure, either of which would send the design back for review.
Worked problem
How much headroom does the pilot leave?
The F16 provides 1,382,400 CU-seconds a day. The estimate totals about 892,600. How many CU-seconds are left, and what share is that? If a one-off backfill of 300,000 CU-seconds were added on the same day, what would the total share be?
Show solution
- Left: 1,382,400 − 892,600 = 489,800 CU-seconds.
- As a share: 489,800 ÷ 1,382,400 ≈ 0.35, about 35 in 100.
- With the backfill: 892,600 + 300,000 = 1,192,600.
- Share: 1,192,600 ÷ 1,382,400 ≈ 0.86, about 86 in 100, above the 80 review threshold.
Answer: About 35 in 100 of the day is left, and a 300,000 CU-second backfill would push the day to about 86 in 100, which is why large one-off jobs must be sliced or run at weekends.
Operating the pilot
A design is only as good as how it is run, so Ines's next slides covered operations. Facilities owned the response to temperature alerts and had a runbook from lesson 5. The data team owned the pipeline itself: the heartbeat rule, the stream health tile, the row-count comparison between readings and readings_clean from lesson 11 and the workspace monitoring eventhouse. Changes would go through Git and the FDH Stores deployment pipeline, Dev to Test to Prod, with the Activator rules deployed stopped and started deliberately after each release, and with the rule from lesson 11 that no eventhouse column is renamed without checking what refers to it.
| Concern | Owner | Mechanism |
|---|---|---|
| A unit warms up | Facilities on-call | Freezer warm and Cooler warm rules, runbook |
| A sensor goes silent | Facilities and data team | Heartbeat rule, stream health tile |
| The cleaned table stops filling | Data team | Row-count comparison tile, .show ingestion failures |
| Capacity pressure | Data team, Elena | Monday review of the capacity metrics app, 80 in 100 threshold |
| Changes break something | Data team | Git, deployment pipeline, dependency check before renames |
| Battery replacement | Facilities contractor | Low battery rule |
Risks and unknowns
Elena asked for the risks in plain words, and Ines gave five. The defrost rule had only four days of live evidence; two weeks were required, and the start of the pilot would be delayed if a false alarm appeared before November 24. Wireless outages longer than fifteen minutes would delay the ten-minute statistics beyond the watermark and drop some readings from that table, though not from the eventhouse. The IoT Hub was a single route in; if it failed, every unit would go silent at once, which the heartbeat rule would report but could not fix. The capacity estimate rested on three days of live data. And the gateway that fed the nightly loads still had a single member until January, which did not affect the freezers but did affect the capacity budget if failed loads had to be rerun during the day.
Dana added a risk from her side: the on-call technician's phone needed the Teams app with notifications allowed out of hours, which facilities would check for each person on the rota. Elena noted that this was exactly the kind of risk that no amount of engineering inside Fabric could remove.
The decision and the plan
Elena approved the pilot with three conditions: two weeks of clean defrost evidence by November 24, the 80 in 100 capacity review threshold, and a written check of every on-call phone. The plan that went into the hub's design table had five dates, all of them future: November 24, the defrost evidence review; December 1, deployment to FDH Stores [Test]; December 14, a full rehearsal with facilities, including a simulated failure out of hours; January 4, 2027, go-live on the F16 at Brandon; and February 1, a review to decide whether to add sensors at two more stores.
| Date | Milestone |
|---|---|
| November 24, 2026 | Review two weeks of live data for defrost false alarms |
| December 1, 2026 | Deploy to FDH Stores [Test] through the deployment pipeline |
| December 14, 2026 | Full rehearsal with facilities, including an out-of-hours simulated failure |
| January 4, 2027 | Go-live on the F16 at the pilot store |
| February 1, 2027 | Review results; decide on two more stores |
Looking back over the course
Ines's last slide mapped the pilot to the DP-700 skills these sessions had covered, which Nikolai suggested she keep for her own exam revision in May. Streaming ingestion and processing: the eventstream, KQL update policies, Spark structured streaming and windowing with a watermark. Monitoring: the Monitor hub, run histories, notebook snapshots, workspace monitoring, semantic model refresh history, the capacity metrics app and Activator alerts on job events. Errors: six incidents across pipelines, dataflows, notebooks, the warehouse, the eventstream and the eventhouse. Optimization: lakehouse table maintenance, Spark settings, warehouse predicates and gold tables, pipeline shape, and eventstream and eventhouse choices such as materialized views and caching. Nikolai's habit question had run through all of it: who reads this data, and how fast do they need it?
Common mistakes
MistakePresent a design without separating evidence from assumptions.
InsteadLabel each claim as measured, partly measured or assumed.
MistakeSize a capacity on average daily use alone.
InsteadWatch peak smoothed use too, with a review threshold.
MistakeTreat the alert as finished once Activator sends it.
InsteadCheck the human end: on-call phones, runbooks and ownership.
MistakeLeave the stream itself unmonitored.
InsteadMonitor silence, table gaps and capacity as well as temperatures.
Summary and key terms
- State requirements as numbers: latency, false alarms, retention and cost.
- Use each Real-Time Intelligence item for its strength: eventstream to ingest, eventhouse to query, dashboard to show, Activator to act, Spark for code-heavy derived tables.
- Separate measured evidence from assumptions in a design review.
- Budget capacity in CU-seconds per day and watch peaks with a review threshold.
- Assign owners for alerts, pipeline health, capacity and changes.
- Name risks plainly, including those outside the platform, and plan dated milestones.
- Design review
- A meeting where a design is checked against requirements, evidence, costs and risks before it is built or launched.
- Review threshold
- A pre-agreed measure that triggers a decision when it is crossed.
- Runbook
- Written instructions for responding to an alert or operating a system.
- Capacity budget
- An estimate of how a capacity's CU-seconds are shared among workloads.
- Single point of failure
- A component whose failure stops the whole system.
Practice problems
Work each problem on paper first, then reveal the answer to check.
Which claim in the review rested on only four days of evidence?
Show answer
That the alert rule ignores defrost cycles.
What share of an F16 day did the whole hub's estimate use?
Show answer
About 65 in 100, with the freezer pilot about 22 in 100.
What would happen if peak smoothed use passed 80 in 100 in a week?
Show answer
The team would lengthen dashboard intervals, reschedule the statistics job hourly or consider an F32.
Name a risk that engineering inside Fabric could not remove.
Show answer
On-call phones not set to receive Teams notifications out of hours.
What is the single route in for sensor data?
Show answer
The IoT Hub; if it fails, every unit goes silent at once.
Lesson quiz · 5 questions
Score 60% or more to complete this lesson.
Create a free account to save your progress, take quizzes and earn a certificate.