
MSAZ-321 · Lesson 11 of 12 · 20 min
Troubleshooting failures
▶ Video coming soon A video version of this lesson is on the way.
Late on Thursday morning, November 12, after the alerts had gone live, Nikolai and Ines sat down with the hub's incident log. In two and a half weeks of trial running there had been six failures worth writing up, one in nearly every kind of item DP-700 names: a pipeline, a dataflow, a notebook, a warehouse procedure, an eventstream and an eventhouse. Nikolai wanted Ines to see that, behind the different error messages, the method was always the same.
A method for every failure
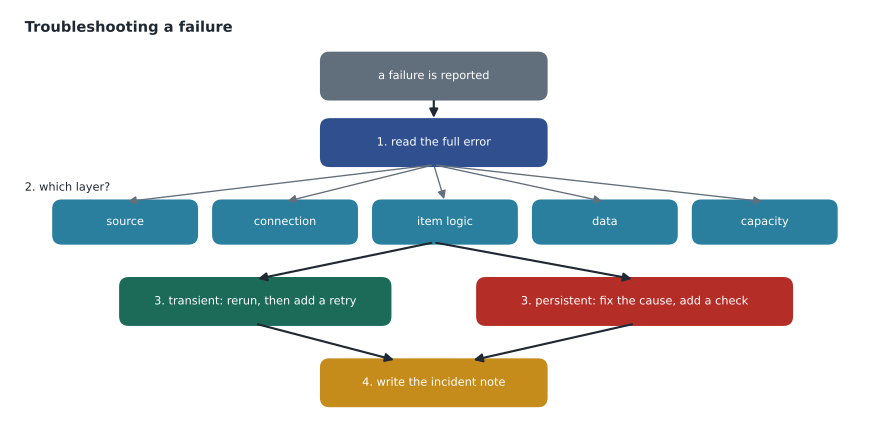
Nikolai's method had five steps. Read the error in full, including the code and the activity or cell it came from, before doing anything else. Place it in a layer: the source, the connection, the Fabric item's own logic, the data, or the capacity. Decide whether it is transient, likely to pass on its own, such as a network blip, or persistent, certain to happen again until something changes, such as a renamed column. Fix it, which for a transient failure may just be a rerun and for a persistent one means a change. And prevent it, by a retry, a check, an alert or an agreement with the people upstream.
| Layer | Typical errors | Where to look first |
|---|---|---|
| Source | Timeouts, a busy or offline source, missing files | Copy activity output, source owner |
| Connection | Gateway offline, expired credentials, firewall | Connection and gateway status, error text |
| Item logic | Renamed columns, bad expressions, wrong parameters | Notebook snapshot, activity input, query text |
| Data | Type conversion failures, unexpected values, duplicates | Rejected rows, ingestion failures, sample of the data |
| Capacity | Throttling, rejected operations, timeouts under load | Capacity metrics app, Monitor hub |
Pipeline: the gateway that rebooted
On October 29, copy_sales failed at 1:12 a.m. with an error saying the on-premises data gateway could not be reached. The layer was the connection. The gateway's server, a virtual machine in the Winnipeg office, had installed Windows updates and restarted at 1:00 a.m., and the copy had tried to start during the restart. The failure was transient: Ines's rerun at 8:20 a.m. worked. Prevention came in three parts. The server's update window moved to 4 a.m. on Sundays, after the weekly maintenance. The copy activity got a retry policy of two retries ten minutes apart, which would have ridden out the restart. And the infrastructure team planned a second gateway member in a cluster for January, so one member could restart while the other served the copy.
Dataflow: credentials that expired
On October 31 the finance targets dataflow failed with a credentials error on its SharePoint connection. Its refresh history showed the query that failed and the message that the credentials were invalid. The layer was the connection again, but this failure was persistent: the connection had been created with the finance analyst's own account, and she had changed her password. A rerun would fail every time until someone updated the connection. Ines updated it to use a service principal with read access to the targets folder, so the load no longer depended on one person's sign-in, and added the connection to the list of credentials whose expiry the team tracked.
Notebook: the column that was renamed
On November 3, nb_clean_sales failed in its third cell with an AnalysisException saying a column called PromoCode could not be resolved. The notebook snapshot showed the cell and the full message, which listed the columns Spark could see, including one called PromotionCode. The layer was item logic meeting a change upstream: a StockLine update had renamed the column. Liam Ferreira confirmed the change had been in the release notes. The fix was a one-line rename in the notebook. The prevention was more interesting. Ines added a schema check at the top of the notebook that compared the raw table's columns with an expected list and failed with a clear message naming the missing and unexpected columns, and Liam agreed to tell the data team a week before any StockLine change to the export.
expected = {"SaleId", "StoreNumber", "SaleDate", "ProductCode", "Quantity", "UnitPrice", "PromotionCode"}
actual = set(spark.table("lh_raw.stockline_sales").columns)
missing, extra = expected - actual, actual - expected
if missing:
    raise ValueError(f"StockLine export changed: missing {sorted(missing)}, new {sorted(extra)}")
Warehouse: two runs at once
On November 4, the load_day procedure in wh_sales failed with an error saying a snapshot isolation transaction had been aborted because of an update conflict. Fabric warehouses use snapshot isolation, so two transactions that update or delete the same table at the same time can conflict, and one is rolled back. Query insights showed two calls of load_day overlapping by a minute: the scheduled 1 a.m. run and a manual run Ines had started late the evening before to test a change, which had been queued and started at almost the same time. The failure was transient in the sense that a rerun worked, but the cause would recur whenever two runs overlapped. The pipeline's concurrency was set to 1, so a second run would wait for the first, and Ines made a habit of testing in the Dev copy of the warehouse rather than the one the schedule used.
Eventstream: two sensors with new firmware
On November 10, within an hour of the live stream starting, the eventstream's data insights showed a small but steady count of events failing to reach the eventhouse destination. The eventstream's runtime logs gave the reason: a data type conversion error on TemperatureC. Two sensors, F-08 and C-03, had been updated to firmware 2.1 by the contractor, and that firmware sent the temperature as a string, such as "-18.4", instead of a number. The layer was data. Ines changed the Manage fields step to convert the field explicitly to a number, which accepted both forms, and the errors stopped. The readings lost in the meantime, about 50 minutes from two sensors, were recovered from the IoT Hub's archive container.
Eventhouse: the policy that failed quietly
The last incident had caused no visible error at all. On the morning of November 11, the dashboard's stream health tile showed readings arriving normally, but the least-headroom tile showed no data after 9:40 the night before. readings was filling; readings_clean was not. The update policy from lesson 2 was failing, and because it was not transactional, ingestion into readings carried on without complaint. The eventhouse records these failures, and the management command .show ingestion failures listed them, each naming the table, the time and the error: the policy's query referred to the BatteryPct column, which Ines had renamed to Battery the previous evening while tidying the schema.
.show ingestion failures
| where FailedOn > ago(1d)
| project FailedOn, Table, OriginatesFromUpdatePolicy, Details
| take 10

.show table readings_clean policy update
Ines restored the column name, re-ingested the missing hours into readings_clean by running the policy's function over the raw readings for that period, and added a rule to the team's change list: before renaming any column in an eventhouse table, check which functions, update policies and materialized views refer to it. Nikolai also added a tile to the facilities dashboard comparing the row counts of readings and readings_clean over the last hour, so a silent gap would show up as a mismatch.
Measuring how quickly problems are found
Ines put the six incidents into a table of when each failure happened, when someone noticed and when it was fixed. Nikolai asked her to calculate two figures that teams use to judge their own monitoring: time to detect and time to resolve.
# Time to detect and time to resolve for the hub's first six incidents
from datetime import datetime as dt
from statistics import median
incidents = [  # (name, failed, detected, resolved)
    ("gateway reboot",      dt(2026, 10, 29, 1, 12), dt(2026, 10, 29, 8, 5),   dt(2026, 10, 29, 8, 50)),
    ("dataflow credentials",dt(2026, 10, 31, 2, 0),  dt(2026, 10, 31, 9, 30),  dt(2026, 10, 31, 11, 15)),
    ("renamed column",      dt(2026, 11, 3, 1, 20),  dt(2026, 11, 3, 7, 50),   dt(2026, 11, 3, 9, 10)),
    ("update conflict",     dt(2026, 11, 4, 1, 27),  dt(2026, 11, 4, 7, 45),   dt(2026, 11, 4, 8, 30)),
    ("firmware strings",    dt(2026, 11, 10, 14, 5), dt(2026, 11, 10, 14, 40), dt(2026, 11, 10, 14, 55)),
    ("silent policy",       dt(2026, 11, 10, 21, 40),dt(2026, 11, 11, 8, 15),  dt(2026, 11, 11, 9, 30)),
]
detect = [(d - f).total_seconds() / 60 for _, f, d, r in incidents]
resolve = [(r - d).total_seconds() / 60 for _, f, d, r in incidents]
for (name, *_), td, tr in zip(incidents, detect, resolve):
    print(f"{name:21s} detected after {td:5.0f} min, resolved {tr:4.0f} min later")
print(f"median time to detect {median(detect):.0f} min, median time to resolve {median(resolve):.0f} min")gateway reboot detected after 413 min, resolved 45 min later dataflow credentials detected after 450 min, resolved 105 min later renamed column detected after 390 min, resolved 80 min later update conflict detected after 378 min, resolved 45 min later firmware strings detected after 35 min, resolved 15 min later silent policy detected after 635 min, resolved 75 min later median time to detect 402 min, median time to resolve 60 min
What this code does
The program lists the six incidents with the time each failure happened, the time someone noticed and the time it was fixed. For each it subtracts to get how long the failure went unnoticed and how long the fix took after that, and then gives the middle value of each across all six. The output shows that most failures went unnoticed for six or seven hours, because they happened overnight and nobody was told, while fixes took around an hour once someone was looking.
The figures told the story Nikolai wanted Ines to see. Fixing was quick, typically under an hour and a half once someone looked. Finding out was slow: five of the six failures sat unnoticed for six hours or more, and the only one found quickly was the eventstream's, because Ines happened to be watching it on its first day. That was why lesson 5's job-event rule and the pipeline's Teams failure branch mattered more than any single fix: they would turn hours of detection into minutes.
Worked problem
What would the new alerts have changed?
The gateway failure happened at 1:12 a.m. and was noticed at 8:05 a.m. With the job-event rule, the data team's on-call engineer would be messaged within 5 minutes, and the fix took 45 minutes. When would the load have been back on track, and would store managers at their 8 a.m. opening have noticed?
Show solution
- Detected: 1:12 + 0:05 = 1:17 a.m.
- Fixed and rerun started: 1:17 + 0:45 = 2:02 a.m.
- The pipeline takes about 30 minutes, so it finishes at about 2:32 a.m.
- Sales Overview refreshes after the load, well before 8 a.m.
Answer: The load would have been finished by about 2:32 a.m., and the store managers would never have known; in practice, the two retries alone would probably have recovered it before anyone woke.
Writing the incident note
Every incident ended with a short note in the team's wiki, in the same shape: what failed and when, how it was noticed, the error, the layer and whether it was transient, the fix, the prevention and the evidence, such as a copy of the error, the notebook snapshot or the query insights rows, because run histories and logs do not last forever. The notes were short, rarely more than half a page, but after a few months they would be the best guide the hub had to its own weak points.
| Item | Error detail lives in | Hub incident |
|---|---|---|
| Pipeline | Activity run error and output | Gateway reboot, October 29 |
| Dataflow Gen2 | Refresh history, per query | Expired credentials, October 31 |
| Notebook | Notebook snapshot, Spark logs | Renamed column, November 3 |
| Warehouse | Error message, query insights | Update conflict, November 4 |
| Eventstream | Data insights and runtime logs | Firmware strings, November 10 |
| Eventhouse | .show ingestion failures, policies | Silent policy failure, November 10 to 11 |
Common mistakes
MistakePress rerun before reading the error.
InsteadRead the full error first; reruns fix only transient failures.
MistakeLeave connections signed in as a person.
InsteadUse a service principal or workspace identity for scheduled loads.
MistakeRename an eventhouse column without checking what uses it.
InsteadCheck functions, update policies and materialized views first.
MistakeJudge monitoring by how fast fixes are made.
InsteadMeasure time to detect as well; overnight failures without alerts sit unnoticed for hours.
Summary and key terms
- Read the error, place it in a layer, decide transient or persistent, fix it and prevent it.
- Connection failures such as gateway restarts and expired credentials are common; retries help the first, service principals the second.
- Schema checks turn upstream renames into clear, early failures.
- Warehouse snapshot isolation can abort concurrent updates; avoid overlapping runs.
- Eventstreams report conversion errors in data insights and runtime logs; eventhouses record update-policy failures in .show ingestion failures.
- Time to detect and time to resolve show where monitoring needs to improve; write a short incident note every time.
- Transient failure
- A failure likely to pass on its own, such as a brief network or gateway outage.
- Persistent failure
- A failure that will recur until something is changed.
- Snapshot isolation
- The warehouse's transaction model, in which concurrent updates to the same table can conflict.
- Ingestion failure
- A record of data or an update policy failing to load into an eventhouse table.
- Time to detect
- How long a failure goes unnoticed.
- Time to resolve
- How long it takes to fix a failure after it is noticed.
Practice problems
Work each problem on paper first, then reveal the answer to check.
Why was the dataflow failure persistent rather than transient?
Show answer
The connection used a person's credentials that had changed, so every rerun would fail.
What did the schema check add?
Show answer
A clear, early failure naming missing and unexpected columns.
Why did load_day fail on November 4?
Show answer
Two runs overlapped, and snapshot isolation aborted one on an update conflict.
How did Ines find the silent update-policy failure?
Show answer
With .show ingestion failures, after the dashboard showed readings_clean was not filling.
What did time to detect reveal?
Show answer
Overnight failures went unnoticed for hours, so alerting mattered more than faster fixes.
Lesson quiz · 5 questions
Score 60% or more to complete this lesson.
Create a free account to save your progress, take quizzes and earn a certificate.