
MSAZ-321 · Lesson 3 of 12 · 20 min
Writing KQL queries
▶ Video coming soon A video version of this lesson is on the way.
On Wednesday afternoon, November 4, the October archive was in eh_sensors, and Ines had her first real question to answer with Kusto Query Language: exactly when did freezer F-06 start to fail on October 17, and when would an alert have fired? Nikolai had written KQL for years in Azure Data Explorer and Azure Monitor, and he started where he always started, with the shape of the language rather than its long list of functions.
The shape of a KQL query
A KQL query starts with a table and passes rows through a chain of operators separated by the pipe character. Each operator takes a table in and hands a table on: where filters rows, project chooses and renames columns, extend adds calculated columns, summarize aggregates, sort orders and take or top limits the result. Reading a query from top to bottom is reading what happens to the data, in order, which is the main reason analysts find KQL easier to read than nested SQL. Statements end at the end of the query, and comments start with two slashes.
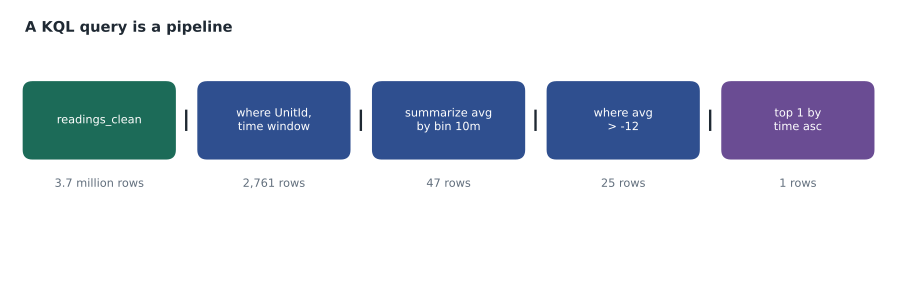
// When did F-06's ten-minute average first rise above minus 12?
readings_clean
| where UnitId == "F-06"
| where ReadingTime between (datetime(2026-10-17 00:00) .. datetime(2026-10-17 07:40))
| summarize AvgTemp = avg(TemperatureC), Readings = count() by bin(ReadingTime, 10m)
| where AvgTemp > -12
| top 1 by ReadingTime asc
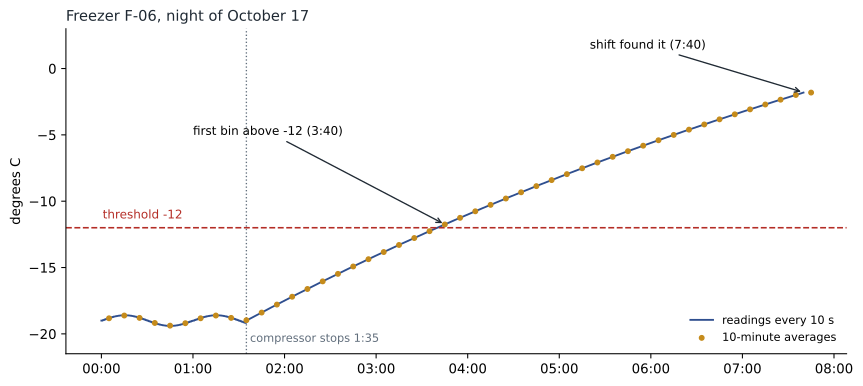
The query returned one row: the ten-minute bin starting at 3:40 a.m., with an average of minus 11.75 degrees from 60 readings. Ines read it twice. Filtering on UnitId and time first is the habit that matters most for speed, because the engine can skip whole extents of data that cannot match; time filters are especially cheap because data is organized by arrival time. The bin function rounds each timestamp down to the start of its interval, so summarize by bin produces tumbling windows, the same idea as the eventstream's group by in MSAZ-320.
# Reproducing the KQL query's logic: F-06 on October 17, ten-minute bins
import math
from datetime import datetime as dt, timedelta

fail = dt(2026, 10, 17, 1, 35)                 # the compressor stopped
readings, t = [], dt(2026, 10, 17, 0, 0)
while t <= dt(2026, 10, 17, 7, 40):
    if t < fail:
        temp = -19.0 + 0.4 * math.sin(t.minute / 9.5)          # normal cycling
    else:
        minutes = (t - fail).total_seconds() / 60
        temp = 21 - 40 * math.exp(-minutes / 650)               # warming toward the room
    readings.append((t, temp))
    t += timedelta(seconds=10)

bins = {}
for t, temp in readings:                         # bin(ReadingTime, 10m)
    start = t.replace(minute=t.minute // 10 * 10, second=0)
    bins.setdefault(start, []).append(temp)

above = [(b, sum(v) / len(v), len(v)) for b, v in sorted(bins.items()) if sum(v) / len(v) > -12]
b, avg, n = above[0]
print(f"{len(readings)} readings in {len(bins)} bins")
print(f"First bin above -12: {b:%H:%M}, average {avg:.2f} from {n} readings")
print(f"Bins above -12 by 7:40: {len(above)}")2761 readings in 47 bins First bin above -12: 03:40, average -11.75 from 60 readings Bins above -12 by 7:40: 25
What this code does
The program builds a model of F-06's night: steady readings around minus 19 degrees every ten seconds until the compressor stops at 1:35 a.m., then a slow warming toward room temperature. It then does what the KQL query does: it groups the readings into ten-minute bins, averages each bin, and finds the first bin whose average is above minus 12. The output gives the number of readings and bins, the first bin over the threshold and how many bins were over it by the time the shift arrived.
The model reproduced the archive closely, because Nikolai had fitted it to the archive: the compressor stopped at about 1:35 a.m., the first bin above minus 12 started at 3:40 a.m., and by 7:40 a.m. 25 bins had been above the line. An Activator rule on the ten-minute average, evaluated at the end of the bin, would have fired at about 3:50 a.m. With five minutes to deliver the alert and 45 minutes for the technician to drive in, someone would have reached the store at about 4:40 a.m., three hours before the shift, with the unit an hour past the threshold.
The core operators
| Operator | Does | Example |
|---|---|---|
| where | Keeps rows that match a condition | where TemperatureC > -12 |
| project | Chooses, renames or computes columns, dropping the rest | project UnitId, ReadingTime, TemperatureC |
| extend | Adds calculated columns, keeping the rest | extend TempF = TemperatureC * 9 / 5 + 32 |
| summarize | Aggregates rows by groups | summarize avg(TemperatureC) by UnitId |
| bin() | Rounds a value down to a fixed interval | by bin(ReadingTime, 1h) |
| sort by / top | Orders rows; top orders and limits together | top 5 by TemperatureC desc |
| take | Returns some rows, in no particular order | take 10 |
| join | Combines rows from two tables on matching keys | join kind=inner units on UnitId |
| lookup | Adds columns from a small dimension table | lookup units on UnitId |
| make-series | Builds a time series per group, filling gaps | make-series avg(TemperatureC) on ReadingTime step 10m |
| render | Draws a chart in the query editor | render timechart |
Time has its own conveniences. The ago function gives a time relative to now, so where ReadingTime > ago(1h) keeps the last hour. Datetime literals are written as datetime(2026-10-17 03:40), timespans as 10m, 1h or 7d, and between with two dots tests a range including both ends. The now function returns the current UTC time. Everything in the eventhouse is in UTC, so converting to local time for a report is a deliberate step, usually done last; Brandon is on Central Daylight Time in October, five hours behind UTC, and moves to Central Standard Time, six hours behind, on November 1.
Joining to reference data
The readings carried only the unit id. To show unit types and their thresholds, Ines created a small units table with 14 rows: unit id, type, description and alert threshold, minus 12 for freezers and plus 5 for coolers. KQL has two ways to bring it in. The join operator combines two tables on a key and supports kinds such as inner, leftouter and leftanti. The lookup operator is designed for exactly this case, a large fact table enriched from a small dimension table, and it is simpler and usually faster. In KQL the smaller table should generally be on the right of a join.
// Every unit's maximum ten-minute average over the last day, with its threshold
readings_clean
| where ReadingTime > ago(1d)
| summarize AvgTemp = avg(TemperatureC) by UnitId, bin(ReadingTime, 10m)
| summarize WorstAvg = max(AvgTemp) by UnitId
| lookup units on UnitId
| extend Headroom = Threshold - WorstAvg
| project UnitId, UnitType, WorstAvg, Threshold, Headroom
| sort by Headroom asc
Sorting by headroom, the gap between the threshold and the worst average, made a useful daily list: the units at the top had come closest to trouble. In the October archive, apart from F-06 on the 17th, freezer F-02 regularly showed the least headroom, about 3 degrees on busy afternoons, which the facilities team put down to its position next to the garden centre doors.
Variables, functions and time series
Longer queries become readable with let statements, which name a value or a sub-query for use later in the same query. Stored functions, created with a management command, save a query in the database so that dashboards, update policies and colleagues can reuse it, as CleanReadings did in lesson 2. For trends, make-series builds an array of values per group at a fixed step, filling empty steps with a default, and KQL's series functions work on those arrays: series_fit_line fits a trend and series_decompose_anomalies flags points that depart from the expected pattern. Nikolai showed the anomaly function on F-02's month and warned that its results depend on settings that should be tested on known incidents, like F-06's, before anyone trusts them for alerts.
let lookback = 30d;
let step = 1h;
readings_clean
| where ReadingTime > ago(lookback) and UnitId startswith "F-"
| make-series AvgTemp = avg(TemperatureC) default = real(null) on ReadingTime step step by UnitId
| extend Anomalies = series_decompose_anomalies(AvgTemp, 2.5)
| render anomalychart with (anomalycolumns = Anomalies)
Querying a materialized view and the latest state
The latest_reading view from lesson 2 answered the back-office question in one line: latest_reading | lookup units on UnitId. Nikolai added two columns that every live screen should have. The age of each reading, now() minus ReadingTime, shows at a glance whether a sensor has stopped reporting. And the ingestion delay, IngestionTime minus ReadingTime, shows whether the pipeline from sensor to eventhouse is keeping up. In the live stream from November 10 the delay would average under five seconds; in the archive it was meaningless, since the archive was loaded weeks later.
latest_reading
| lookup units on UnitId
| extend AgeSeconds = datetime_diff('second', now(), ReadingTime),
         DelaySeconds = datetime_diff('second', IngestionTime, ReadingTime),
         Status = iff(TemperatureC > Threshold, "Above threshold", "OK")
| project UnitId, UnitType, TemperatureC, Threshold, Status, AgeSeconds, DelaySeconds
| sort by UnitId asc
KQL querysets
A KQL queryset is a Fabric item that holds KQL queries in tabs, connected to one or more data sources such as KQL databases or Azure Data Explorer clusters. Each KQL database also has an embedded queryset for quick exploration, but a separate queryset item can be shared, kept in Git with the workspace and used to build dashboard tiles. Ines created qs_freezers with tabs for the incident query, the daily headroom check and the latest state, and saved the latest-state query to a dashboard, which lesson 4 picks up. Querysets also show each query's duration and the amount of data scanned, which help when tuning, and they can export results to CSV or open them in Power BI.
KQL and SQL side by side
Most of the hub's engineers knew SQL, and KQL databases accept a subset of T-SQL for simple queries, which helps people get started. The explain keyword, placed before a SQL query, returns the equivalent KQL, which is a good way to learn. But the time-series features, the operators like make-series and render, and the management commands are KQL only, so serious work in an eventhouse means learning KQL.
| Task | SQL | KQL |
|---|---|---|
| Filter | WHERE UnitId = 'F-06' | where UnitId == "F-06" |
| Choose columns | SELECT UnitId, TemperatureC | project UnitId, TemperatureC |
| Aggregate | SELECT UnitId, AVG(TemperatureC) ... GROUP BY UnitId | summarize avg(TemperatureC) by UnitId |
| Group by time | DATE_TRUNC or DATEADD arithmetic | by bin(ReadingTime, 10m) |
| Top rows | SELECT TOP 5 ... ORDER BY ... DESC | top 5 by TemperatureC desc |
| Last hour | WHERE ReadingTime > DATEADD(hour, -1, GETUTCDATE()) | where ReadingTime > ago(1h) |
Two differences catch SQL users. KQL is case-sensitive for table names, column names and operators, and == compares strings case-sensitively, while =~ compares them without case. And KQL strings use double or single quotes, where SQL uses single. Ines lost ten minutes to the second before Nikolai pointed at her query.
Worked problem
Turning the incident into an alert threshold
The facilities team wants an alert if a freezer's ten-minute average exceeds minus 12. F-06's first bin above minus 12 starts at 3:40 a.m. and the rule evaluates at the end of each bin. Delivery takes 5 minutes and the technician needs 45. When does the technician arrive, and how much earlier is that than the 7:40 a.m. discovery?
Show solution
- The bin 3:40 to 3:50 completes at 3:50 a.m., when the rule fires.
- Alert delivered: 3:50 + 0:05 = 3:55 a.m.
- Technician arrives: 3:55 + 0:45 = 4:40 a.m.
- Earlier than the shift: 7:40 − 4:40 = 3 hours.
Answer: The technician would arrive at about 4:40 a.m., three hours before the shift found the failure.
Elena's question from lesson 1 now had a real answer: three hours of warning, enough to move most of F-06's stock into other freezers. Ines added the figures to the pilot's business case, noting that they came from the archive and a model fitted to it.
Common mistakes
MistakeFilter after summarizing.
InsteadFilter on time and keys first so the engine can skip data.
MistakeCompare strings with = as in SQL.
InsteadUse == for case-sensitive equality and =~ to ignore case.
MistakePut the large table on the right of a join.
InsteadKeep the small table on the right, or use lookup for dimension tables.
MistakeMix local time and UTC in the same query.
InsteadWork in UTC and convert to local time as a final step.
Summary and key terms
- KQL queries pass a table through operators separated by pipes, read top to bottom.
- where, project, extend, summarize, bin, top, join, lookup, make-series and render cover most needs.
- Filter on time and keys first; data organized by arrival time makes time filters cheap.
- let statements and stored functions make queries readable and reusable; series functions find trends and anomalies.
- KQL querysets hold shareable queries in tabs and feed dashboard tiles.
- KQL is case-sensitive; explain converts simple SQL into KQL.
- Kusto Query Language
- The query language of eventhouses, Azure Data Explorer and Azure Monitor.
- Pipe operator
- The | character that passes one operator's output to the next.
- bin()
- A function that rounds values down to fixed intervals for grouping.
- lookup
- An operator that enriches a large table with columns from a small one.
- make-series
- An operator that builds evenly spaced time series per group.
- KQL queryset
- A Fabric item that stores and runs KQL queries in tabs.
Practice problems
Work each problem on paper first, then reveal the answer to check.
What does summarize ... by bin(ReadingTime, 10m) produce?
Show answer
One row per group per ten-minute interval, that is, tumbling windows.
Why filter on UnitId and time before summarizing?
Show answer
So the engine can skip data that cannot match, which is much faster.
When is lookup better than join?
Show answer
When enriching a large table from a small dimension table.
What does the AgeSeconds column on the live screen reveal?
Show answer
Whether a sensor has stopped reporting.
How do you compare strings without regard to case in KQL?
Show answer
With the =~ operator.
Lesson quiz · 5 questions
Score 60% or more to complete this lesson.
Create a free account to save your progress, take quizzes and earn a certificate.