
MBA-514 · Lesson 5 of 12 · 19 min
Competitive advantage: cost, differentiation and value creation
Two weeks into the course, Dr. Ashford puts a deceptively simple question on the board: what does it mean for a firm to have a competitive advantage? Grace says it means being better than competitors. Owen says it means earning higher profits. Leo says it means customers prefer you. Dr. Ashford says each answer captures something, but none is precise enough to guide a decision, and that the most useful definition comes from thinking carefully about value.
The value stick
Adam Brandenburger and Harborne Stuart, in a 1996 article titled Value-Based Business Strategy, proposed a way of thinking about value that the cohort met briefly in MBA-512. Picture a vertical stick. At the top is the customer's willingness to pay, the most a customer would pay for the product. At the bottom is the supplier's willingness to sell, the least that suppliers of inputs, including employees, would accept to provide them. The length of the stick, willingness to pay minus willingness to sell, is the value created by the transaction. Price and cost divide it: the customer's surplus is willingness to pay minus price, the firm's margin is price minus cost, and the suppliers' surplus is cost minus their willingness to sell.
The value stick yields a precise definition. A firm has a competitive advantage when it creates more value than its rivals, that is, when the gap between its customers' willingness to pay and its suppliers' willingness to sell is wider than theirs. Economists such as David Besanko, David Dranove, Mark Shanley and Scott Schaefer, in their textbook Economics of Strategy, express the same idea as the difference between perceived benefit and cost, B minus C. A firm that creates more value than its rivals can, in principle, offer customers more surplus than competitors can while still earning a higher margin. Whether it actually earns that margin depends on competition and bargaining, but creating more value is the precondition.
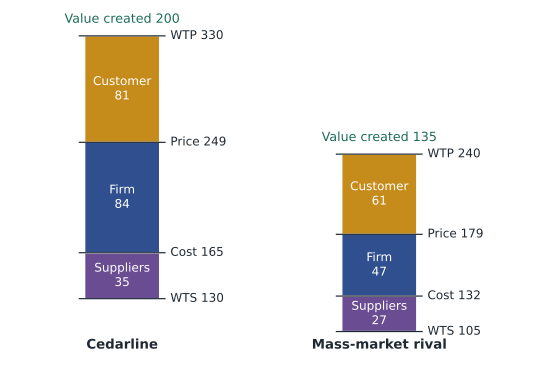
There are two ways to widen the stick. A firm can raise customers' willingness to pay more than it raises cost, which is differentiation, or lower cost more than it lowers willingness to pay, which is cost advantage. It can also lower suppliers' willingness to sell by being a more attractive customer or employer, for example by offering steadier orders, better working conditions or a reputation that employees value. This last route is often overlooked, but firms known as good places to work can hire talented people at lower pay than rivals, and suppliers often accept lower prices from customers who pay promptly and forecast reliably.
Cost advantage
A cost advantage arises when a firm can produce a product of comparable value at lower cost than rivals. Porter's value chain is the starting point for finding its sources: the firm's costs are the sum of the costs of its activities, and each activity has cost drivers. The main drivers are scale, since fixed costs spread over more units and larger operations can use more efficient methods; learning, since unit costs fall as cumulative experience grows; capacity utilization; linkages among activities, such as designing products that are cheaper to assemble; input costs, including access to cheap labour, materials or capital; location; and policy choices, such as which features to include and how much variety to offer.
Economies of scale have limits. Beyond a minimum efficient scale, unit costs flatten, and very large operations can suffer diseconomies through coordination costs, bureaucracy and weaker motivation. What matters strategically is the size of the minimum efficient scale relative to the market: if it is large, only a few firms can operate at efficient scale, which raises entry barriers.
The experience curve describes how unit costs fall with cumulative production. T. P. Wright, studying aircraft production in 1936, observed that the labour hours needed to build an airframe fell by about 20 per cent each time cumulative output doubled. Bruce Henderson and the Boston Consulting Group generalized the observation in the 1960s to total costs in many industries, arguing that a firm with the largest cumulative volume would have the lowest costs and should therefore seek market share aggressively. The relationship is usually written as a power law, where the progress ratio is the fraction of unit cost remaining after each doubling.
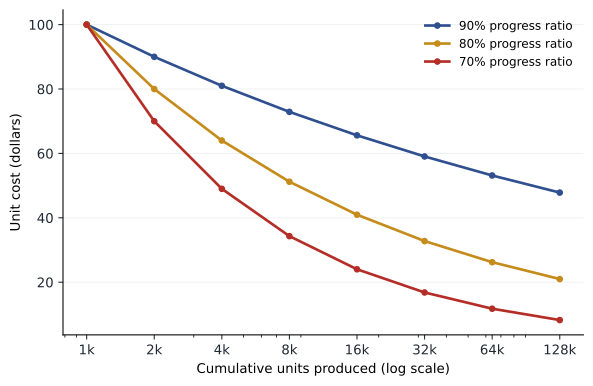
The experience curve was an important insight and has been misused. Learning can spill over to competitors through suppliers, employees who change jobs and reverse engineering, so the leader's advantage may not last. Pursuing share at any price can trap firms in price wars. And cost advantages built on a particular technology can vanish when the technology changes. Today the curve is most useful for forecasting the costs of new technologies such as solar panels and batteries, whose costs have fallen steeply as cumulative production has grown, and for assessing whether a cost lead is likely to be durable.
Differentiation advantage
Differentiation raises customers' willingness to pay by offering something they value that rivals do not. The sources lie throughout the value chain: product features and performance, quality and reliability, design, customer service, delivery speed, brand reputation, the experience of buying and using the product, and the ecosystem of complements around it. The key word is valued. Differentiation that customers do not care about adds cost without adding willingness to pay, and many firms have added features that engineers liked and customers ignored.
Differentiation works best when it is aimed at customers who care most about it, when the attributes are hard for rivals to copy and when the firm can signal them credibly. Signals matter because many attributes, such as durability, are hard to judge before purchase. Brands, warranties, reputations, certifications and visible investments in quality act as signals. A lifetime repair guarantee, for example, is a credible signal of durability because it would be expensive for a firm whose products wear out.
Differentiation also has a cost side. A firm differentiates profitably only if the increase in willingness to pay exceeds the increase in cost. The code below compares Cedarline's waterproof shell with a mass-market rival's, then uses the experience curve to examine Northfield's position against a larger competitor.
# 1. Value created: Cedarline's waterproof shell against a mass-market rival (dollars per jacket)
firms = {"Cedarline": {"wtp": 330, "price": 249, "cost": 165, "wts": 130},
         "Rival":     {"wtp": 240, "price": 179, "cost": 132, "wts": 105}}
for name, f in firms.items():
    value = f["wtp"] - f["wts"]
    print(f"{name:9s} value created {value:3d}: customer {f['wtp'] - f['price']:3d}, "
          f"firm {f['price'] - f['cost']:3d}, suppliers {f['cost'] - f['wts']:3d}")
gap = (firms["Cedarline"]["wtp"] - firms["Rival"]["wtp"]) - (firms["Cedarline"]["cost"] - firms["Rival"]["cost"])
print(f"Cedarline's extra willingness to pay exceeds its extra cost by {gap} dollars")

# 2. Experience curve: Northfield against a rival with four times its cumulative volume
import math
def cost_at(volume, base_volume, base_cost, progress):
    b = -math.log(progress, 2)
    return base_cost * (volume / base_volume) ** (-b)
for progress in (0.90, 0.85, 0.80):
    own = 10.00                                   # Northfield's unit cost at 400,000 cumulative units
    rival = cost_at(1_600_000, 400_000, own, progress)
    print(f"Progress ratio {progress:.0%}: Northfield {own:.2f}, rival {rival:.2f}, "
f"rival cost advantage {1 - rival / own:.0%}")Cedarline value created 200: customer 81, firm 84, suppliers 35 Rival value created 135: customer 61, firm 47, suppliers 27 Cedarline's extra willingness to pay exceeds its extra cost by 57 dollars Progress ratio 90%: Northfield 10.00, rival 8.10, rival cost advantage 19% Progress ratio 85%: Northfield 10.00, rival 7.22, rival cost advantage 28% Progress ratio 80%: Northfield 10.00, rival 6.40, rival cost advantage 36%
The first part shows Cedarline creating 200 dollars of value per jacket against the rival's 135. Its customers would pay 90 dollars more, and it costs Cedarline 33 dollars more to make and sell the jacket, so the net differentiation advantage is 57 dollars. Cedarline shares the extra value: its customers keep 81 dollars of surplus against the rival customers' 61, and Cedarline's margin of 84 dollars is well above the rival's 47. Cedarline's suppliers also capture slightly more, because its specialized fabric and membrane suppliers have bargaining power.
The second part makes a point about cost advantage. If two firms started at the same unit cost and learning follows a progress ratio of 85 per cent, a rival with four times Northfield's cumulative volume, two doublings ahead, would have unit costs about 28 per cent lower. That is a severe disadvantage in a business where buyers choose on price. But Northfield does not compete with the rival on the same parts; it has shifted toward lower-volume, more complex assemblies for equipment makers, where the rival's volume advantage applies less and where engineering support raises customers' willingness to pay.
Is the advantage sustainable?
An advantage that rivals can quickly copy is soon competed away. Richard Rumelt, in a 1984 essay, called the barriers that protect a firm's advantage isolating mechanisms, the firm-level counterpart of entry barriers. They include the costly-to-imitate resources of lesson 4, customer switching costs, economies of scale relative to the market, network effects, reputation, and the fit among activities from lesson 1. Pankaj Ghemawat, in a 1986 Harvard Business Review article titled Sustainable Advantage, grouped the sources into three kinds: size in the target market, superior access to resources or customers, and restrictions on competitors' options, such as patents, regulation or a rival's fear of cannibalizing its own business.
Measuring advantage is harder than defining it. The most direct evidence is a persistent gap in return on invested capital between the firm and its industry, after adjusting for differences in accounting. Decompositions help locate the source: if the firm's prices are higher than rivals' for comparable products while its costs are similar, the advantage is in willingness to pay; if its prices are similar and its costs lower, the advantage is in cost. Cedarline's data, which the cohort examined in MBA-501, show that its gross margin fell from 54 to under 50 per cent over four years as promotions grew and its mix shifted to wholesale. Its differentiation advantage is real at the product level, but its strategy has been giving it away in pricing and channel choices.
Worked problem
Assessing a differentiation proposal
Cedarline's product team proposes adding a recycled-fibre insulation to the Ridgeline jacket. It would raise unit cost by 14 dollars. A conjoint survey suggests target customers would pay about 11 dollars more for it, and the team expects it to improve the brand's environmental reputation. Should Cedarline adopt it, and how could the proposal be improved?
Show solution
- Compare willingness to pay and cost: an 11-dollar increase in willingness to pay against a 14-dollar increase in cost narrows the value stick by 3 dollars per jacket on its own.
- Consider spillovers: if the change strengthens the durability and environmental reputation across the range, it may raise willingness to pay for other products; the team should estimate this rather than assume it.
- Look for cost reductions: the team could negotiate volume pricing with the insulation supplier, use the material only in the best version of the jacket, or redesign the jacket to use less insulation without losing warmth.
- Signal credibly: pairing the change with a repair guarantee and transparent sourcing information could raise willingness to pay further.
Answer: As proposed, the change destroys a little value per jacket. It is worth adopting only if the team can either cut its cost below 11 dollars or show measurable spillovers to the rest of the range, and the best version of the Ridgeline is the natural place to test it.
Common mistakes
MistakeCompetitive advantage means higher market share.
InsteadAdvantage means creating more value than rivals; share can be bought at the expense of value.
MistakeDifferentiation means adding features.
InsteadDifferentiation pays only when the increase in willingness to pay exceeds the increase in cost.
MistakeThe experience curve guarantees the leader the lowest cost.
InsteadLearning spills over, technologies change and share pursued at any price can destroy value.
MistakeSuppliers and employees are only costs.
InsteadLowering their willingness to sell, by being an attractive partner, also widens the value created.
Summary and key terms
- Value created equals customers' willingness to pay minus suppliers' willingness to sell; price and cost divide it among customers, the firm and suppliers.
- A firm has a competitive advantage when it creates more value than its rivals.
- Cost advantage comes from drivers such as scale, learning, utilization, linkages, input costs, location and policy choices.
- The experience curve describes unit costs falling by a constant fraction with each doubling of cumulative output.
- Differentiation raises willingness to pay with valued attributes, ideally hard to copy and credibly signalled.
- Isolating mechanisms such as inimitable resources, switching costs, scale, network effects and fit sustain advantage.
- Willingness to pay
- The most a customer would pay for a product.
- Willingness to sell
- The least a supplier or employee would accept to provide an input.
- Competitive advantage
- Creating more value, the gap between willingness to pay and willingness to sell, than rivals.
- Experience curve
- The relationship in which unit cost falls by a constant fraction each time cumulative output doubles.
- Minimum efficient scale
- The smallest output at which unit costs reach their lowest level.
- Isolating mechanism
- A barrier that protects a firm's advantage from imitation by rivals.
Practice problems
Work each problem on paper first, then reveal the answer to check.
A product has a willingness to pay of 80, a price of 60, a cost of 45 and a supplier willingness to sell of 35. Divide the value created.
Show answer
Value created 45: customer 20, firm 15, suppliers 10.
With a progress ratio of 80 per cent, what is unit cost after three doublings if the first unit cost 100?
Show answer
100 × 0.8 × 0.8 × 0.8 = 51.2.
Why is a lifetime repair guarantee a credible signal of durability?
Show answer
It would be costly for a firm whose products failed often, so only a firm with durable products would offer it.
Name Ghemawat's three categories of sustainable advantage.
Show answer
Size in the target market, superior access to resources or customers, and restrictions on competitors' options.
Lesson quiz · 5 questions
Score 60% or more to complete this lesson.
Create a free account to save your progress, take quizzes and earn a certificate.