
DCT-110 · Lesson 2 of 12 · 20 min
The data centre industry and its growth
In his first week Jamal sits through the site orientation with Anjali Desai, the site manager. She opens with a slide that shows the campus a decade ago: one hall, one generator yard, forty customers. The next slide shows it today: four halls, a second substation under construction and a waiting list of tenants. The growth on that slide is the story of the whole industry, and it is the reason Jamal was hired. This lesson looks at where the demand comes from, how the industry is organized, what limits its growth and what all of that means for the people who work in it.
Where the demand comes from
For most of its history, data centre demand grew steadily with the economy. More businesses put their systems online, more people bought smartphones, more video was streamed and more files were stored. Several trends layered on top of each other:
- Digital services: banking, shopping, government services, health records and entertainment moved online, and each needs servers that are always on.
- Cloud computing: instead of running their own computer rooms, companies rent capacity from cloud providers, who build very large, efficient campuses to supply it.
- Video and content: streaming video is a large share of internet traffic, and content providers place servers close to users to deliver it quickly.
- Mobile and edge: phones, connected vehicles and sensors create data that is often processed in smaller sites close to where it is made.
- Artificial intelligence: training and running large AI models takes enormous amounts of computing on graphics processors, and since about 2023 this has become the fastest-growing source of demand.
The last trend changed the industry in a few years. AI training uses clusters of thousands of processors that work together on one job for weeks. The processors run hot and are packed tightly to keep the connections between them short. A rack of the newest AI systems can draw more than 100 kilowatts, and NVIDIA's GB200 NVL72 rack, introduced in 2024, draws roughly 120 kW. A typical enterprise rack draws 5 to 10 kW. That jump is why Hall D at Stonebridge looks so different from Hall A, and why the industry is rebuilding its designs around liquid cooling.
How much electricity data centres use
The International Energy Agency estimated that data centres worldwide used about 415 terawatt-hours of electricity in 2024, roughly 1.5 % of global electricity use, and projected about 945 TWh by 2030. The United States accounted for about 45 % of the 2024 total. In the United States, Lawrence Berkeley National Laboratory estimated that data centres used about 176 TWh in 2023, about 4.4 % of national electricity, up from 58 TWh in 2014, and projected 325 to 580 TWh by 2028, between about 7 % and 12 %. Estimates vary between sources and change as each new report is published, but every serious estimate shows fast growth.
A terawatt-hour is a billion kilowatt-hours. To put the scale in household terms: a home that uses about 10,000 kWh a year would need about 100,000 years to use one terawatt-hour. A single large AI campus can use more electricity than a city of several hundred thousand people.
# Campus electricity in household terms
it_load_mw = 15.2          # average IT load across the campus
pue = 1.25                # power usage effectiveness (Lesson 5)
home_kwh_per_year = 20000  # typical household use, illustrative
facility_mw = it_load_mw * pue
annual_mwh = facility_mw * 8760
homes = annual_mwh * 1000 / home_kwh_per_year
print(f"Facility load      : {facility_mw:.1f} MW")
print(f"Energy per year    : {annual_mwh:,.0f} MWh")
print(f"Equivalent homes : about {homes:,.0f}")Facility load : 19.0 MW Energy per year : 166,440 MWh Equivalent homes : about 8,322
Quebec homes use more electricity than most because many are heated electrically, so the household figure in the code is higher than it would be elsewhere. Even so, the campus uses as much electricity as about 8,300 homes, and Hall D alone accounts for more than half of it.
Who builds and runs data centres
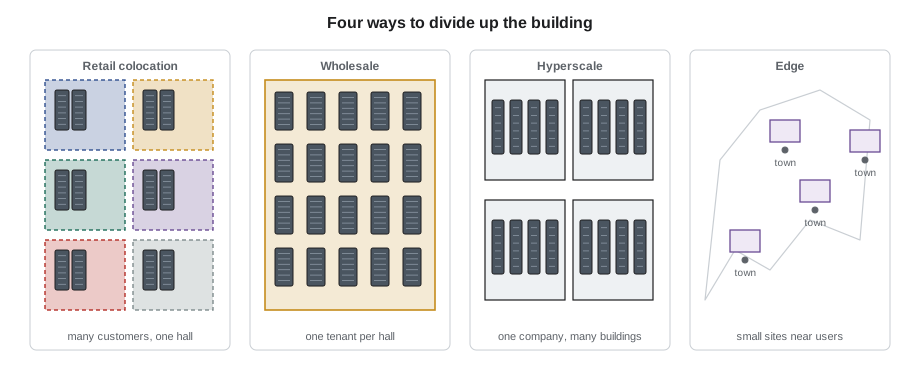
The industry has several kinds of owners and operators, and a technician's daily work depends a great deal on which one employs them:
- Hyperscalers: the largest cloud and internet companies, which build and operate their own campuses of many buildings. They run highly standardized designs and their own operations teams.
- Colocation providers: companies that build data centres and rent space, power and cooling to many customers. Retail colocation rents a few racks or a cage; wholesale colocation rents whole suites or halls to a single tenant.
- Build-to-suit developers: companies that build a data centre to one tenant's design and lease it to that tenant, often a hyperscaler.
- Enterprises: organizations that own data centres for their own use, such as banks, governments and universities.
- Edge operators: companies that run many small sites close to users, often at cell towers, cable landing stations or telecom offices.
Stonebridge Data is a colocation provider with a wholesale business: Hall A is retail colocation, Halls B and C are leased whole, and Hall D was built to Corvid AI's requirements. Jamal therefore works for the building owner and serves many customers, which shapes everything from how tickets are handled to who is allowed to touch which equipment.
Where data centres are built
Data centres cluster where four things come together: reliable electricity at a reasonable price, many fibre routes, suitable land and a low risk of floods, earthquakes and other hazards. Once a few large sites are built in a region, carriers bring more fibre, suppliers set up nearby and skilled workers move there, which attracts more data centres.
Montréal is one of Canada's main markets, with Toronto. Quebec's attraction is clean, low-cost hydroelectricity and a cold climate that allows free cooling for much of the year. Growth there is now limited by power: Hydro-Québec allocates large new loads carefully, and new data centre loads above about 5 MW need approval through the province's process for large industrial loads. In 2025 most new capacity in the Montréal area was smaller, high-density projects, such as QScale's 14 MW expansion at Lévis, rather than large greenfield campuses. Stonebridge's YUL-2 campus is on the old industrial land near the Beauharnois generating station, one of the largest hydro stations on the St. Lawrence.
What limits growth
Every data centre market in North America faces the same constraints, and a technician hears about them constantly:
- Power: utilities need years to build new transmission lines and substations, and the largest projects ask for hundreds of megawatts.
- Equipment: transformers, switchgear, generators and chillers have long delivery times, sometimes more than a year.
- Water: evaporative cooling uses a great deal of water, and some regions restrict it.
- Communities: neighbours object to noise from cooling fans and generators, to new transmission lines and to large windowless buildings, and local governments have tightened rules.
- People: the industry needs electricians, mechanics, controls technicians and data centre technicians faster than they can be trained.
The last constraint is the reason programs like this one exist. Industry surveys have reported staffing difficulty for years, and the growth of AI has made it sharper. A technician who learns the building well and follows its rules carefully is valuable anywhere.
What growth means on the floor
Growth is not abstract for Jamal. It shows up as a steady stream of new equipment to install, new customers to badge in, construction crews building the next hall, and higher and higher power in the racks. It also shows up as change in the work itself:
- More liquid cooling, which brings pipes, coolant distribution units and leak detection into the white space.
- Heavier racks, some arriving fully built and weighing over a tonne, which changes how equipment is moved and installed.
- Higher-capacity power: busway overhead, higher-voltage distribution and larger UPS systems.
- More fibre: AI clusters connect thousands of processors with dense fibre cabling.
- More automation and remote monitoring, which changes what technicians watch for and how they respond.
Roz tells Jamal that the newest hall and the oldest hall are both his to learn. Customers still run critical systems in Hall A, and its older equipment needs more care, not less.
Efficiency and sustainability
Because data centres use so much electricity, their owners and customers watch efficiency closely. The best-known measure is power usage effectiveness, PUE, the ratio of all the energy the facility uses to the energy used by the IT equipment. Uptime Institute's 2025 survey found that the industry average PUE was about 1.54, unchanged for six years, while the largest hyperscale operators report figures around 1.1. Water use is measured with water usage effectiveness, WUE, in litres per kilowatt-hour of IT energy. Many operators also report the carbon intensity of the electricity they use and buy renewable energy to match their consumption.
Technicians affect these numbers more than they might think. A blanking panel left out of a rack lets hot air leak back to the front, so the cooling works harder. A door left open between hot and cold aisles does the same. A filter left dirty makes fans work harder. Lesson 6 explains airflow; for now Jamal learns the rule that every opening in a cold aisle is a small leak in the efficiency of the whole hall.
Worked problem
Reading a news headline
A Montréal newspaper headline says that a new AI data centre in Quebec will use as much power as 30,000 homes. Jamal's friend asks whether that is true or exaggerated.
Show solution
- Ask what IT load the project has. The article says 40 MW of IT.
- Estimate facility power: with a PUE of about 1.2, that is 48 MW.
- Estimate yearly energy: 48 MW × 8,760 h = about 420,000 MWh.
- Divide by a Quebec household's use of about 20,000 kWh: about 21,000 homes. The headline is in the right range; the exact figure depends on the household use assumed and on how fully the site is loaded.
Answer: Comparisons with homes are rough, but a technician should be able to check them with the arithmetic in this lesson rather than taking them on faith.
The carbon side of the electricity
Customers increasingly ask not only how much electricity a data centre uses, but how much carbon dioxide that electricity puts into the air. The answer depends on the grid. A kilowatt-hour from a grid supplied mostly by hydroelectric or nuclear stations emits very little; a kilowatt-hour from a grid with many coal or gas plants emits much more. Operators report the carbon intensity of their supply in grams of CO2 equivalent per kilowatt-hour, and many buy renewable energy, through long-term contracts or certificates, to match their use. The figures in the code below are rounded, illustrative values of the kind published for each grid; real figures change each year as grids add and retire plants.
# Annual emissions of the same campus on different grids (illustrative grid intensities)
annual_mwh = 166_440
grids = {  # grid: grams of CO2 equivalent per kWh, rounded and illustrative
    "Quebec": 2, "Ontario": 30, "Alberta": 500, "Virginia": 280,
}
for grid, g_per_kwh in grids.items():
    t_co2 = annual_mwh * 1000 * g_per_kwh / 1_000_000
print(f"{grid:22s} {g_per_kwh:4d} g/kWh -> about {t_co2:9,.0f} t CO2e per year")Quebec 2 g/kWh -> about 333 t CO2e per year Ontario 30 g/kWh -> about 4,993 t CO2e per year Alberta 500 g/kWh -> about 83,220 t CO2e per year Virginia 280 g/kWh -> about 46,603 t CO2e per year
The same campus can emit hundreds of times more carbon on one grid than on another. That is one reason clean-power regions attract data centres, and one reason operators in other regions sign contracts for wind, solar and nuclear power. For a technician, the practical point is that every kilowatt-hour saved through good airflow and careful operation saves carbon as well as money.
Jobs created by growth
A large campus employs fewer people than its size suggests: a building with tens of megawatts may have a few dozen permanent operations staff. But construction employs hundreds of trades workers for years, and the operating staff are skilled, well paid and hard to find. Each new hall needs technicians who know the house rules from the first day, which is why operators value training programs and certifications.
Common mistakes
MistakeAssuming all data centres are run by giant technology companies.
InsteadMany are run by colocation providers, enterprises and edge operators, each with different rules and work.
MistakeTreating energy figures from different reports as identical.
InsteadEstimates differ by method and date; quote the source and the year.
MistakeThinking growth only affects new halls.
InsteadOlder halls still carry critical customer systems and need careful work.
MistakeLeaving small airflow leaks because they seem harmless.
InsteadEvery gap in containment or a rack costs cooling energy across the whole hall.
MistakeIgnoring the community side of the business.
InsteadNoise, generator testing and traffic affect neighbours; follow site rules on test times and deliveries.
Summary and key terms
- Demand for data centres comes from digital services, cloud computing, video, edge computing and, since about 2023, artificial intelligence.
- Data centres used about 415 TWh worldwide in 2024, about 1.5 % of global electricity, and use is expected to roughly double by 2030.
- The main business models are hyperscale, retail and wholesale colocation, build-to-suit, enterprise and edge.
- Markets form where power, fibre, land and low hazard risk come together; power is now the main limit on growth.
- AI racks can draw over 100 kW, compared with 5 to 10 kW for a typical enterprise rack.
- PUE and WUE measure efficiency; technicians affect them through airflow, doors, filters and blanking.
- Hyperscaler
- A very large cloud or internet company that builds and runs its own data centre campuses.
- Colocation
- A business that rents space, power and cooling in its data centre to many customers.
- Wholesale colocation
- Renting a whole suite, hall or building to a single tenant.
- Edge site
- A small data centre close to users, often at a telecom site.
- Terawatt-hour
- A billion kilowatt-hours of energy.
- PUE
- Power usage effectiveness: total facility energy divided by IT equipment energy.
Practice problems
Work each problem on paper first, then reveal the answer to check.
Name three sources of demand for data centres.
Show answer
Any three of digital services, cloud computing, video and content, mobile and edge, and artificial intelligence.
What is the difference between retail and wholesale colocation?
Show answer
Retail rents racks or cages to many customers; wholesale rents a whole suite or hall to one tenant.
What is the main constraint on data centre growth in most North American markets today?
Show answer
Electrical power: utilities need years to supply very large new loads.
A hall has 10 MW of IT load and a PUE of 1.3. What is the facility load?
Show answer
13 MW.
Lesson quiz · 5 questions
Score 60% or more to complete this lesson.
Create a free account to save your progress, take quizzes and earn a certificate.