
STAT-141 · Lesson 1 of 12 · 26 min
Statistics and data in everyday life
Every day you are handed numbers that someone hopes will change your mind. A news story says that one in four young adults has delayed buying a home. An advertisement claims a toothpaste is recommended by nine out of ten dentists. A pharmacy flyer reports that a new cold remedy cuts symptoms by a day. Your bank tells you your spending on restaurants is up 18 percent this year. Statistics is the discipline that lets you ask the right questions about claims like these: where did the numbers come from, how much do they vary, how sure can anyone be, and what would it take to be fooled? It is also the toolkit you will use to produce trustworthy numbers yourself, in business, health care, public policy, the social sciences and almost any job that involves deciding things with incomplete information.
This course is a first course in statistics for students in any program. It assumes only high-school algebra. You will learn to collect data sensibly, describe it with graphs and numbers, reason about chance, and draw conclusions that carry an honest statement of uncertainty. Students in the sciences take STAT-151, which leans toward laboratory and field design; this course leans toward the data you meet in business, health, the media and everyday life, and it puts more weight on interpretation than on technical machinery. Later courses such as ACCT-341 Data Analytics for Accountants build directly on what you learn here.
A running example
To keep things concrete, we follow an invented team throughout the course: the Community Data Lab at the invented Northline College in Omaha, Nebraska. The lab is run by an instructor, Dr. Maya Desjardins, and three student analysts: Owen, who studies business; Aisha, who studies nursing; and Lucas, who studies sociology. Local organizations bring the lab questions. The city transit office wants to know how long residents spend commuting. A café chain wants to know whether a new loyalty app increases visits. A community health clinic wants to understand screening test results. A food bank wants to plan for demand. All of the data in this course are invented and generated by code so that every number can be checked, but the questions are the ones real analysts face.
What statistics is
Statistics is the science of learning from data in the presence of variability. Variability is the key word. If every household spent exactly the same on groceries, one household would tell you everything. In reality spending varies from family to family, from week to week, and even for the same family in two identical-looking weeks. Statistics gives us ways to describe that variability, to separate real patterns from the noise, and to say how much confidence a conclusion deserves.
It helps to distinguish two broad activities. Descriptive statistics summarizes the data in hand: a table of average commute times by neighborhood, a graph of monthly sales, the percentage of survey respondents who own a car. Inferential statistics uses the data in hand to draw conclusions about something larger that we did not fully observe: all residents of the city, all future customers, everyone who might take a medication. Inference always carries uncertainty, because a different sample would have given somewhat different numbers. Much of this course is about measuring that uncertainty honestly.
Populations, samples, parameters and statistics
Four words carry a lot of weight in statistics. The population is the entire group you want to learn about, such as every adult who lives in the city. A sample is the part of the population you actually observe, such as the 400 adults who answered the transit survey. A parameter is a number that describes the population, such as the true average commute time of all adults in the city; it is usually unknown. A statistic is a number computed from the sample, such as the average commute time of the 400 respondents; we use statistics to estimate parameters.
| Term | Meaning | Transit example |
|---|---|---|
| Population | Everyone or everything you want to describe | All adults who live in the city and commute to work or school |
| Sample | The members of the population you actually measure | The 400 adults who completed the transit survey |
| Parameter | A fixed but usually unknown number describing the population | The true mean one-way commute time of all commuting adults |
| Statistic | A number computed from the sample | The mean commute time of the 400 respondents, 25.1 minutes |
| Variable | A characteristic that differs from one individual to another | Commute time, travel mode, neighborhood, age |
A useful habit is to say these out loud when you read a claim. 'Sixty-two percent of Canadians support the policy' is a statement about a population parameter; the number reported almost certainly came from a sample statistic, perhaps from a poll of 1,500 people. The gap between the two, and how large it might be, is exactly what a margin of error tries to express. We will build up to margins of error in lesson 10.
Kinds of variables
Every data set is organized around individuals (also called cases or units) and variables. The individuals might be people, households, stores, days or hospital visits; each row of a spreadsheet is usually one individual. A variable is any characteristic recorded for each individual; each column is usually one variable.
Variables come in two main types. A categorical variable places each individual into a group: travel mode (car, bus, bicycle, walk), province or state of residence, blood type, whether a customer used the loyalty app. A quantitative variable takes numerical values for which arithmetic makes sense: commute time in minutes, household income, number of café visits last month, systolic blood pressure. Quantitative variables can be discrete, taking separate values you can count (visits, children, defects), or continuous, taking any value in a range (time, weight, temperature).
Watch out for numbers that are really categories. Postal codes, phone numbers and student ID numbers are written with digits, but averaging them is meaningless. A survey item that asks people to rate satisfaction from 1 to 5 sits in between: the numbers have an order, but the distance from 1 to 2 may not mean the same as the distance from 4 to 5. Lesson 2 introduces the four levels of measurement, which make these distinctions precise.
# A tiny data set from the transit survey: each row is one respondent.
rows = [
    # id, travel mode, commute minutes, age, has car (1 = yes)
    (101, "car",     22, 34, 1),
    (102, "bus",     41, 19, 0),
    (103, "bicycle", 15, 27, 1),
    (104, "car",     18, 52, 1),
    (105, "walk",     9, 23, 0),
    (106, "bus",     35, 61, 0),
]
modes = [r[1] for r in rows]
minutes = [r[2] for r in rows]
print("individuals (rows):", len(rows))
print("categorical variable 'mode' takes values:", sorted(set(modes)))
print("quantitative variable 'minutes': mean =", round(sum(minutes) / len(minutes), 1))
print("share who own a car:", sum(r[4] for r in rows), "of", len(rows))individuals (rows): 6 categorical variable 'mode' takes values: ['bicycle', 'bus', 'car', 'walk'] quantitative variable 'minutes': mean = 23.3 share who own a car: 3 of 6
Even this tiny table shows the basic logic. It makes sense to average the commute minutes, but not the ID numbers. For the travel mode, the natural summary is a count or a percentage in each category. Lesson 3 shows how to graph each type, and lesson 4 how to summarize them with numbers.
The statistical investigation cycle
Statisticians often describe their work as a cycle with five stages, sometimes abbreviated PPDAC: problem, plan, data, analysis and conclusion. The problem stage turns a vague concern into a question that data can answer. The plan stage decides what to measure, on whom, and how. The data stage collects and cleans the data. The analysis stage summarizes, graphs and models it. The conclusion stage interprets the results, states their limits and often raises new questions, which start the cycle again.
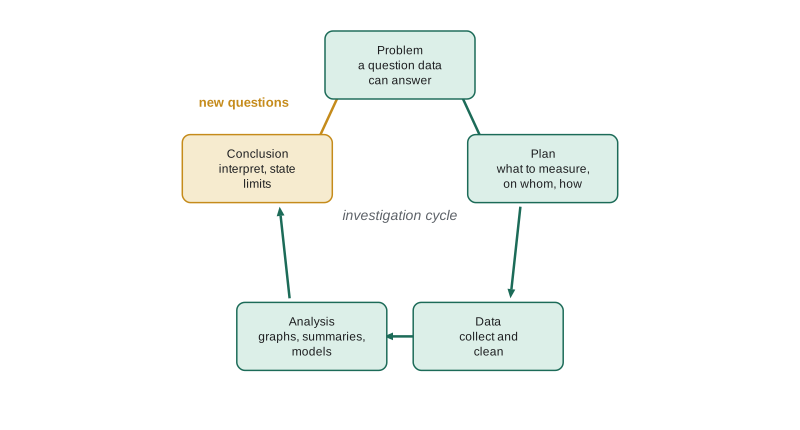
Consider the café chain's question. The vague concern is 'Is our loyalty app working?' A sharper problem statement is 'Do customers who join the loyalty app make more visits per month than similar customers who do not, and by how much?' The plan must decide how to compare fairly: if the most loyal customers were the first to sign up, a simple comparison of app users with non-users would overstate the app's effect. That is a theme we will meet again and again: how the data were collected often matters more than how cleverly they are analyzed.
Where data come from
Data reach you through many routes. Some are collected for a purpose, such as a survey designed to answer a question or an experiment comparing two treatments. Others are collected as a by-product of running an organization: sales transactions, website clicks, hospital admissions, bus fare card taps. These administrative and transactional records are often huge, but they were not designed to answer your question, and they may leave out exactly the people you care about. A third source is official statistics produced by government agencies, which publish carefully documented data on population, employment, prices, health and much more.
In the United States several federal agencies share the work. The Census Bureau runs the decennial census (the next one is in 2030) and the annual American Community Survey, which provides detailed social and economic data for every county. The Bureau of Labor Statistics publishes the monthly unemployment rate from the Current Population Survey and the Consumer Price Index, which measures inflation. Other agencies, such as the National Center for Health Statistics, cover health. Most of their data can be downloaded free.
Official statistics have two great strengths: they use large, carefully designed samples, and they publish detailed documentation of their methods, so you can judge how much to trust them. When you see a striking number in the news, one of the best habits you can develop is to trace it back to its source and read how it was produced.
Misleading statistics
Numbers can mislead without being false. A headline might say 'Crime up 50 percent' when the count went from two incidents to three. A company might report that sales doubled without mentioning that the previous year was a pandemic low. A chart might start its vertical axis at 95 instead of 0, making a small difference look dramatic. Averages can hide enormous variation, and percentages can hide tiny base numbers. Lesson 3 looks closely at misleading graphs, and lesson 12 returns to responsible reporting.
A short list of questions catches most problems. Who collected the data, and did they have a reason to want a particular answer? How were the individuals chosen, and who is missing? What exactly was measured, and how was the question worded? How large is the sample? Compared with what? Is the difference large enough to matter in practice, not just in a headline? Is a cause being claimed from data that can only show an association?
| Claim you might read | Question to ask | Why it matters |
|---|---|---|
| Nine out of ten dentists recommend Brand X | Nine out of how many, and were they allowed to recommend more than one brand? | A small or self-selected group, or a question allowing many answers, inflates the share |
| Crime rose 50 percent in our neighborhood | From what count to what count? | A rise from 2 to 3 incidents is 50 percent but may be chance |
| People who drink coffee live longer | Was this an experiment or an observational study? | Coffee drinkers may differ in income, health or habits |
| Average household income is up | Mean or median? Up for whom? | A few very high incomes can raise the mean while most households see no change |
| Online poll: 80 percent oppose the new bylaw | Who chose to answer? | Voluntary online polls attract people with strong opinions |
Data ethics and privacy
Data are about people, and collecting and using them carries responsibilities. Respondents should know what they are agreeing to, data should be kept secure, and results should be reported in ways that do not identify individuals. Even when names are removed, combinations of variables such as postal code, birth date and gender can single someone out, a risk called re-identification. Statistical agencies deal with this by suppressing small counts and rounding published figures.
In the United States there is no single general privacy law; instead, sector laws apply, such as HIPAA for health information and FERPA for student records, plus a growing number of state consumer privacy laws. Research involving people at colleges and universities must follow the federal Common Rule and be approved by an institutional review board. Federal statistical agencies operate under confidentiality laws, including Title 13 of the U.S. Code for the Census Bureau.
Ethics also covers honesty in analysis. Choosing which results to report after seeing many, quietly dropping inconvenient data points or presenting a graph designed to exaggerate are all forms of misleading people with numbers. The Community Data Lab follows a simple rule: decide what you will measure and how you will analyze it before you look, report what you found even when it is disappointing, and say clearly how sure you are.
Worked problem
Population, sample and variables
The café chain emails all 5,200 members of its loyalty app and asks how many times they visited last month and whether they would recommend the chain to a friend. 840 members reply. Identify the population of interest, the sample, the variables and their types, and one concern about using these replies to describe all loyalty members.
Show solution
- Population: all 5,200 loyalty app members (or, more broadly, all of the chain's customers if that is what the chain wants to know about).
- Sample: the 840 members who replied.
- Variables: number of visits last month, a quantitative discrete variable; would recommend (yes or no), a categorical variable.
- Concern: members who reply may be more enthusiastic than those who do not, so the share who would recommend the chain could be too high. This is non-response bias, which lesson 2 covers.
Answer: The population is all app members, the sample is the 840 respondents, visits is quantitative and recommendation is categorical, and self-selected replies may overstate enthusiasm.
Common mistakes
MistakeTreating a sample statistic as if it were the population parameter.
InsteadRemember that a different sample would give a somewhat different number, and look for a margin of error.
MistakeAveraging numbers that are really labels, such as postal codes or ID numbers.
InsteadDecide whether each variable is categorical or quantitative before summarizing it.
MistakeTrusting a striking percentage without asking about the base count.
InsteadAsk what the numbers were before and after; small counts swing wildly.
MistakeAssuming a large data set must be representative.
InsteadAsk who is in the data and who is missing; size does not fix a biased collection method.
MistakeConcluding that one thing causes another from an observed association.
InsteadAsk whether the data came from an experiment; otherwise look for other explanations.
Summary and key terms
- Statistics is the science of learning from data when individuals vary.
- Descriptive statistics summarizes the data in hand; inferential statistics draws conclusions about a larger population with a measure of uncertainty.
- A parameter describes a population and is usually unknown; a statistic describes a sample and estimates the parameter.
- Variables are categorical or quantitative, and quantitative variables are discrete or continuous.
- The investigation cycle runs from problem to plan, data, analysis and conclusion, and how data are collected often matters most.
- Good habits include tracing numbers to their source, asking who is missing, and protecting the privacy of the people behind the data.
- statistics
- The science of collecting, describing and drawing conclusions from data in the presence of variability.
- population
- The entire group of individuals that a study wants to describe.
- sample
- The part of the population that is actually observed.
- parameter
- A number that describes a population, usually unknown.
- statistic
- A number computed from a sample, used to estimate a parameter.
- categorical variable
- A variable that places each individual into one of several groups.
- quantitative variable
- A variable with numerical values for which arithmetic makes sense.
- discrete variable
- A quantitative variable with countable separate values.
- continuous variable
- A quantitative variable that can take any value in an interval.
- re-identification
- Discovering who an anonymous record belongs to by combining its details.
Practice problems
Work each problem on paper first, then reveal the answer to check.
A poll of 1,200 voters finds 47 percent support for a proposal. Is 47 percent a parameter or a statistic?
Show answer
A statistic, because it describes the sample of 1,200.
Classify each variable: number of siblings, favorite music genre, body temperature, postal code.
Show answer
Quantitative discrete; categorical; quantitative continuous; categorical (the digits are labels).
Why might a company's customer database not represent all residents of a city?
Show answer
It includes only people who became customers, who may differ in income, age or location from other residents.
Name the five stages of the statistical investigation cycle.
Show answer
Problem, plan, data, analysis and conclusion.
A headline says thefts doubled. What is the first question you should ask?
Show answer
Doubled from what number to what number, over what period?
Why can removing names fail to protect privacy?
Show answer
Combinations of other details, such as birth date and postal code, can still identify a person.
Give one strength of official statistics from a national agency.
Show answer
Large, carefully designed samples with published documentation of methods.
What is the difference between descriptive and inferential statistics?
Show answer
Descriptive summarizes the data in hand; inferential generalizes to a larger population with stated uncertainty.
Lesson quiz · 5 questions
Score 60% or more to complete this lesson.
Create a free account to save your progress, take quizzes and earn a certificate.