
MBA-611 · Lesson 7 of 12 · 20 min
Choosing markets: country analysis and attractiveness
Dr. Tan opens the seventh session by projecting a list of 190 countries and asking the cohort where Cedarline should sell its jackets. Owen suggests starting with the largest economies. Grace points out that half of them have no winter. Leo asks whether online sales count as entering a market. Dr. Tan says that every one of these reactions is the beginning of a method. Choosing markets means narrowing a very long list to a short one using a sequence of filters, each more detailed and more expensive than the last, and then comparing the finalists on both their attractiveness and the company's ability to win there.
Why market choice matters
Entering a foreign market is expensive. A company must learn local rules, adapt products, build distribution, win customers who have never heard of it and support a new organization, often for several years before it earns a profit. Research on international expansion finds that many companies enter too many markets too quickly, spreading management attention and capital thinly, and that market choice is one of the strongest predictors of international success. Choosing well also means choosing what not to do: every market entered is a commitment that is costly to reverse, and exits can damage a brand in markets that matter more.
A sequence of filters
A practical market selection process has four stages. The first is a broad screen of all possible countries on a few indicators that rule out clearly unsuitable markets: for Cedarline, a climate with real winters or mountain activities, income per person high enough to afford premium apparel, and no sanctions or severe political risk. The second is an attractiveness assessment of the remaining countries using more indicators, such as market size, growth, competition and access. The third is a fit assessment that asks whether the company can win there, given its brand, products, channels and the distance between home and the market. The fourth is a detailed study of two or three finalists, including visits, interviews with potential partners and customers, and financial projections.
At each stage, the data become more specific and more costly to gather. Early screens can use public data from the World Bank, the International Monetary Fund and national statistics offices. Later stages need industry data from research firms, trade associations and government export agencies, such as the US Commercial Service and the Export-Import Bank of the United States, and finally primary research with customers, retailers and distributors. Dr. Tan advises the cohort to spend little on the first two stages and much more on the last, because the most expensive mistake is to commit to a market on the strength of a desk study.
Country analysis with PESTEL
A PESTEL analysis, which the cohort used in MBA-514 for the macro environment, organizes the questions to ask about a country: political factors such as stability, policy direction and relations with the home country; economic factors such as growth, income, inflation and exchange rates; social factors such as demographics, lifestyles and attitudes; technological factors such as internet use and logistics; environmental factors such as climate and environmental regulation; and legal factors such as product rules, consumer protection, employment law and intellectual property. Lessons 3, 4, 5 and 6 supplied the tools for most of these. The PESTEL list is a reminder to check them all rather than to focus on market size alone.
Distance still matters: the CAGE framework
Pankaj Ghemawat argued in a 2001 article in the Harvard Business Review, Distance Still Matters, that companies systematically overestimate the attractiveness of large foreign markets because they ignore the costs and risks of distance. He proposed the CAGE framework, which measures distance between home and a foreign market in four dimensions. Cultural distance includes differences in language, religion, social norms and values. Administrative distance includes the absence of shared trade agreements, currencies or legal systems, colonial ties and political hostility. Geographic distance includes physical distance, time zones, climate and transport links. Economic distance includes differences in income, costs and the quality of infrastructure and resources.
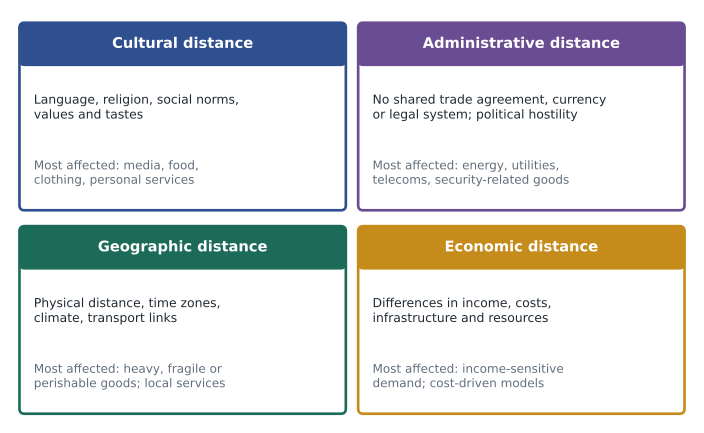
Ghemawat's insight is that the importance of each type of distance depends on the industry. Cultural distance matters most for products with high linguistic content, such as media, or that touch on identity, such as food and clothing. Administrative distance matters most where governments are heavily involved, such as energy, telecommunications and defense. Geographic distance matters most for heavy, fragile or perishable goods and for services that require local presence. Economic distance matters most when demand varies with income or when the business model depends on cost differences. He also showed, using the gravity model from lesson 2, how much distance reduces trade: countries that share a language or a trade agreement trade far more with each other than countries that do not.
For a company, the framework suggests adjusting raw market size by distance. A market that is half the size of another but much closer may be the more attractive option. For American firms, Canada is close on almost every dimension, though administrative distance has grown since 2025 with tariffs, Canadian surtaxes and a consumer backlash against American brands in Canada.
Measuring attractiveness
Attractiveness combines several factors. Market size can be measured by the number of potential customers, by total spending in the category, or by output of the economy as a whole, but category spending is the most relevant. Growth matters because entering a growing market lets a company win new customers rather than taking them from established rivals. Income distribution matters for premium products: a country with high average income but a narrow affluent class may offer fewer customers than a less rich country with a broad middle class. Competitive intensity matters: a market already crowded with strong local and international brands is harder to win. Access matters: tariffs, regulations, distribution structures and the availability of partners determine how costly it is to reach customers.
Managers often combine these factors in a weighted scoring model. Each market is rated on each factor, the ratings are multiplied by weights that reflect the factor's importance for the business, and the weighted ratings are summed. Scoring models are simple, transparent and easy to debate, which is their main value; their weakness is that the weights and ratings are judgments that can be adjusted, consciously or not, to reach a preferred answer. Dr. Tan recommends agreeing on weights before scoring any market and testing whether the ranking changes when weights are varied.
# Weighted market attractiveness scoring with a distance adjustment (scores 1-10)
weights = {"category_size": 0.25, "growth": 0.15, "affluent_buyers": 0.20,
           "competition": 0.15, "access": 0.15, "partner_availability": 0.10}
markets = {
    "Market A (large, near)":      {"category_size": 10, "growth": 5, "affluent_buyers": 9, "competition": 3, "access": 6, "partner_availability": 8},
    "Market B (mid, Europe)":      {"category_size": 6, "growth": 5, "affluent_buyers": 8, "competition": 5, "access": 7, "partner_availability": 6},
    "Market C (small, Nordic)":    {"category_size": 3, "growth": 6, "affluent_buyers": 9, "competition": 6, "access": 7, "partner_availability": 7},
    "Market D (large, East Asia)": {"category_size": 8, "growth": 6, "affluent_buyers": 8, "competition": 4, "access": 4, "partner_availability": 5},
}
distance = {"Market A (large, near)": 0.10, "Market B (mid, Europe)": 0.30,
            "Market C (small, Nordic)": 0.30, "Market D (large, East Asia)": 0.55}   # CAGE penalty, 0 to 1
for name, r in markets.items():
    raw = sum(weights[k] * r[k] for k in weights)
    adj = raw * (1 - 0.5 * distance[name])
    print(f"{name:<28} attractiveness {raw:4.2f}  distance-adjusted {adj:4.2f}")
# Sensitivity: does the ranking change if competition matters more?
alt = dict(weights, competition=0.30, category_size=0.15, growth=0.10)
best = max(markets, key=lambda m: sum(alt[k] * markets[m][k] for k in alt) * (1 - 0.5 * distance[m]))
print("best market if competition is weighted more heavily:", best)Market A (large, near) attractiveness 7.20 distance-adjusted 6.84 Market B (mid, Europe) attractiveness 6.25 distance-adjusted 5.31 Market C (small, Nordic) attractiveness 6.10 distance-adjusted 5.18 Market D (large, East Asia) attractiveness 6.20 distance-adjusted 4.50 best market if competition is weighted more heavily: Market A (large, near)
In the illustration, the large nearby market leads on raw attractiveness and keeps its lead after the distance adjustment, while the large East Asian market falls from a close second to last once its distance is counted. Weighting competition more heavily does not change the leader, which gives some confidence in the result. The scores, however, say nothing about whether the company can afford to enter the leading market or how long it will take to earn a return there; those questions belong to the entry and financial analysis of the next lessons.
Estimating demand
Once the list is short, managers need estimates of how much they could sell. Three methods are common. The chain ratio method starts with a population and applies a series of percentages: the share in the relevant age and income groups, the share who take part in outdoor activities, the share who buy premium technical apparel, the average annual spending per buyer, and the share the company could realistically win. Estimation by analogy uses the experience of a similar market, adjusted for differences in income and population: if Cedarline sells a given amount per affluent outdoor household at home, a similar market might buy a similar amount per household once the brand is established. Finally, test sales, through online sales, pop-up stores or a small number of wholesale partners, provide real data before a large commitment.
# Chain ratio estimate of the premium technical apparel market in a target country
population = 10_600_000            # e.g. a mid-sized northern European country
steps = [("adults 20-64", 0.60), ("household income in top 40 per cent", 0.40),
         ("active in hiking, skiing or climbing", 0.45), ("buy premium technical apparel", 0.30)]
n = population
for label, share in steps:
    n *= share
    print(f"after '{label}' ({share:.0%}): {n:,.0f} people")
spend = 260                        # average annual spending per buyer, in home currency
market = n * spend
print(f"category spending: {market / 1e6:,.0f} million a year")
for share in (0.02, 0.04, 0.06):
print(f" revenue at a {share:.0%} share: {market * share / 1e6:5.1f} million")after 'adults 20-64' (60%): 6,360,000 people after 'household income in top 40 percent' (40%): 2,544,000 people after 'active in hiking, skiing or climbing' (45%): 1,144,800 people after 'buy premium technical apparel' (30%): 343,440 people category spending: 89 million a year revenue at a 2% share: 1.8 million revenue at a 4% share: 3.6 million revenue at a 6% share: 5.4 million
Waterfall or sprinkler
Companies also choose how many markets to enter at once. A waterfall strategy enters markets one at a time, building experience and resources in each before moving to the next. A sprinkler strategy enters many markets at once or in quick succession. The waterfall reduces risk and lets the company learn, but it can be slow and gives rivals time to take markets the company has not yet reached. The sprinkler builds global presence quickly, which matters when products have short lives, when there are strong network effects or when rivals are racing for the same markets, but it stretches management and capital. Most companies with physical products and modest resources use a waterfall; software companies often use a sprinkler, at least for online sales.
The Uppsala model of internationalization, developed by Jan Johanson and Jan-Erik Vahlne in 1977, describes a waterfall driven by learning. Firms begin in markets with low psychic distance, the factors that make it hard to understand a foreign market, and with modest commitments, and they increase commitment as experience reduces uncertainty. In a 2009 revision, the authors emphasized that being inside business networks, relationships with customers, suppliers and partners, matters even more than country distance. The practical lesson for Cedarline is that a first market should be one where it can learn quickly and find partners who will teach it.
Cedarline's first screen
The cohort applies the method to Cedarline. A first screen keeps countries with cold winters or mountain recreation, income per person above about 40,000 US dollars and low political risk: Canada, the United Kingdom, Ireland, Germany, Austria, Switzerland, the Nordic countries, the Netherlands, France, Japan, South Korea, Australia and New Zealand. A second screen on category size, growth, competition and access, adjusted for CAGE distance, leaves three finalists: Canada, the closest market in culture and geography and with a strong outdoor culture, though American brands there face a consumer backlash since 2025; Germany together with the Nordic countries, large, wealthy and outdoor-oriented; and Japan, large and affluent but the most distant on every dimension. These three become the options in the capstone.
Worked problem
Sizing the Nordic opportunity
Sweden, Norway, Denmark and Finland have a combined population of about 28 million. Assume 60 percent are adults of working age, 40 percent of those are in the top 40 percent of household incomes, 50 percent of those are active in outdoor sports and 30 percent of those buy premium technical apparel, spending an average of 280 a year in Cedarline's home currency. What is the category size, and what revenue would a 3 percent share bring?
Show solution
- Buyers: 28 million × 0.60 × 0.40 × 0.50 × 0.30 ≈ 1.01 million.
- Category spending: 1.01 million × 280 ≈ 282 million a year.
- A 3 percent share: about 8.5 million a year.
- Check by analogy: if Cedarline earns about 4 percent of its home category after decades, 3 percent in a new market within five years would be ambitious; 1 to 2 percent is more realistic early on.
Answer: The Nordic market is attractive per person but small in total, worth perhaps 3 to 8 million a year to Cedarline in five years. It makes most sense combined with Germany, where the same distributor or online operation could serve a much larger market.
Common mistakes
MistakeChoose the largest economies first.
InsteadCategory spending, affluent buyers, competition, access and distance matter more than total output.
MistakeA desk study is enough to commit to a market.
InsteadSpend little on early screens and much more on visits, partner interviews and test sales for finalists.
MistakeScoring models give an objective answer.
InsteadWeights and ratings are judgments; agree on weights first and test whether the ranking is sensitive to them.
MistakeDistance no longer matters in a digital world.
InsteadCultural, administrative, geographic and economic distance still reduce trade and raise the cost of serving markets.
Summary and key terms
- Market selection narrows a long list through broad screens, attractiveness, fit and detailed study of finalists.
- PESTEL organizes country analysis; the CAGE framework measures cultural, administrative, geographic and economic distance.
- Different industries are sensitive to different kinds of distance.
- Weighted scoring models are transparent but depend on judgment; test their sensitivity.
- Demand can be estimated by chain ratios, analogy and test sales.
- Waterfall strategies enter markets one at a time to learn; sprinkler strategies enter many at once for speed.
- CAGE framework
- Ghemawat's measure of cultural, administrative, geographic and economic distance between countries.
- Chain ratio method
- Estimating market size by applying a sequence of percentages to a population.
- Psychic distance
- The factors that make it difficult to understand and operate in a foreign market.
- Waterfall strategy
- Entering foreign markets one at a time.
- Sprinkler strategy
- Entering many foreign markets at once or in quick succession.
- Market attractiveness
- A combined assessment of a market's size, growth, competition and accessibility.
Practice problems
Work each problem on paper first, then reveal the answer to check.
Which dimension of CAGE distance would matter most for a company selling electricity transmission equipment to foreign utilities, and why?
Show answer
Administrative distance, because utilities are heavily regulated and often state-owned, so government relations, procurement rules and trade agreements dominate.
A country has 5 million adults; 30 percent are in the target income group, 20 percent of those buy the category, and each spends 400 a year. What is the category size?
Show answer
5 million × 0.30 × 0.20 × 400 = 120 million a year.
Why might a software company choose a sprinkler strategy while a furniture maker chooses a waterfall?
Show answer
Software can be sold online with little local investment and benefits from speed and network effects; furniture requires distribution, adaptation and logistics in each market.
What did the 2009 revision of the Uppsala model add?
Show answer
It emphasized that relationships within business networks matter more than country distance for internationalization.
Lesson quiz · 5 questions
Score 60% or more to complete this lesson.
Create a free account to save your progress, take quizzes and earn a certificate.