
MBA-611 · Lesson 1 of 12 · 24 min
Why global business: the world economy in 2026
The winter term of the second year opens on a cold Friday evening at the Lakeshore School of Business in Chicago. The cohort has spent a year and a half on accounting, finance, marketing, operations, strategy and people, almost always inside one country. Dr. Mei-Lin Tan, who teaches Global Business, begins by asking each of them to name the last decision at work that was shaped by something that happened outside their own country. Nobody has to think for long. Daniel mentions the tariffs that have changed the price of every bracket Northfield Components ships across the border. Owen talks about the gas prices that jumped when fighting in the Middle East disrupted shipping early in 2026. Leo describes a European customer who asked Kestrel Analytics where its data would be stored. Hana tells the class that a quarter of the nurses Lakeview Health hired last year trained abroad. Grace, now running Second Ascent, says that half the zippers her technicians install come from one factory in Asia.
Dr. Tan nods. Before joining the school, she spent eight years as a trade negotiator for Singapore's trade ministry and twelve years leading international expansion for a Danish consumer brand, opening markets in Asia, Europe and North America. She tells the cohort that global business is not a separate subject for people who work in exporting departments. It is the setting in which every manager now works, whether or not the company sells abroad. A firm that buys inputs, borrows money, hires people or competes with rivals from other countries is already exposed to the world economy. The question is whether it manages that exposure deliberately.
What globalization means
Globalization is the growing integration of national economies through flows across borders. Five flows matter for managers. The first is trade in goods and services: the cars, clothing, software, engineering and tourism that one country sells to another. The second is investment: foreign direct investment, in which a company builds or buys operations abroad and controls them, and portfolio investment, in which investors buy shares and bonds without control. The third is the movement of people, as workers, students and travelers. The fourth is the flow of data, which now carries a large share of services trade and allows a company to serve customers in another country without a single employee there. The fifth is the flow of ideas and technology, through licensing, research collaboration and imitation.
These flows are linked. Trade in components follows the factories that multinationals build abroad; investment follows trade agreements that guarantee access to markets; data flows support the services that multinationals sell to one another. When one flow is restricted, others adjust. A tariff on finished goods can lead a company to invest in a factory inside the protected market, replacing trade with investment. A rule that requires data to stay in one country can lead a software company to open a local data center or to stay out of the market altogether.
Waves of globalization
The world has been here before. Economic historians describe a first wave of globalization from about 1870 to 1914, driven by steamships, railways, the telegraph and the gold standard. Trade and capital flows grew rapidly, and tens of millions of Europeans emigrated to the Americas. The wave ended with the First World War, and the interwar years brought tariffs, currency wars and depression; world trade fell sharply after the United States raised tariffs under the Smoot–Hawley Act of 1930 and other countries retaliated.
A second wave followed the Second World War. The General Agreement on Tariffs and Trade, signed in 1947, cut tariffs on manufactured goods in a series of negotiating rounds, and the Bretton Woods institutions, the International Monetary Fund and the World Bank, provided a framework for currencies and development. Trade grew faster than output for most of the next four decades. A third wave, sometimes called hyperglobalization, began around 1990 with the end of the Cold War, the opening of China and India, the creation of the World Trade Organization in 1995 and the spread of the internet. Supply chains split production into stages located in different countries, and trade grew roughly twice as fast as world output until the financial crisis of 2008.
Since then, the pattern has changed. After 2008, trade grew roughly in line with output rather than faster, a period some economists called slowbalization. From about 2018, rising tariffs between the United States and China, the COVID-19 pandemic, Russia's invasion of Ukraine in 2022 and a series of sanctions and export controls added a new pattern: fragmentation along geopolitical lines. Trade did not collapse. Instead, it was redirected, with more trade among countries that are political allies and less among rivals, and with new routes through connector countries such as Mexico and Vietnam. Dr. Tan calls this the world of managed openness: borders remain open for most business, but governments now intervene far more often, and the rules can change quickly.
The world economy in 2026
The International Monetary Fund's World Economic Outlook of October 2026 expects world output to grow by about 3.1 percent in 2026, down from about 3.5 percent in 2025, and by about 3.4 percent in 2027. The slowdown reflects higher energy prices after the conflict in the Middle East disrupted supplies early in the year, continued trade tensions and limited room for governments and central banks to respond. The Fund expects the United States to grow by about 2.3 percent in both 2026 and 2027, supported by consumer spending and heavy investment in artificial intelligence, with inflation rising to about 3.6 percent this year. It expects China's growth to slow to about 4.5 percent and the euro area's to about 1.1 percent, with inflation in the euro area rising to about 3.1 percent.
Trade has held up better than many expected. In October 2026 the World Trade Organization raised its forecast for growth in the volume of world merchandise trade to about 3.9 percent for 2026 and 4.1 percent for 2027. Much of the strength comes from one category: semiconductors, servers and other goods that support artificial intelligence, which accounted for almost half of the growth in the value of merchandise trade in the first half of 2026. Services trade has been weaker, with the WTO cutting its 2026 forecast to about 3.3 percent as higher fuel costs hit travel and transport. Asia leads the growth in trade; North American imports are expected to grow only slowly.
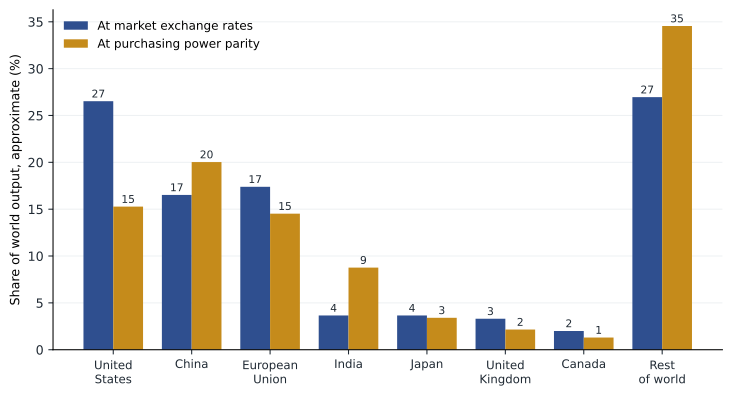
The figure shows why the choice of measure matters. At market exchange rates, which matter for a company converting foreign sales into its home currency, the United States produces roughly a quarter of world output, and China and the European Union about a sixth each. Measured at purchasing power parity, which adjusts for differences in price levels between countries and is a better guide to the volume of goods and services people can buy, China is the largest economy and India rises to third among single countries, behind China and the United States. For a consumer company, market exchange rates indicate the revenue a market could generate today; purchasing power parity and growth rates indicate where volume is growing.
Where Canada and the United States stand
The United States is a large, relatively closed economy by trade share. Exports and imports together equal only about a quarter of its gross domestic product, because its home market is so large. Yet it is the world's largest importer of goods, the largest exporter of services and the largest source and destination of foreign direct investment, and the dollar is the currency in which most world trade and debt are denominated. Its largest trading partners are Mexico, Canada and China, though trade with China has fallen as a share of the total since 2018. The tariffs and trade actions of 2025 and 2026, and the Supreme Court's February 2026 ruling that tariffs could not be imposed under the International Emergency Economic Powers Act, have made trade policy one of the most volatile parts of the environment for American firms. Even companies that sell only at home are affected through the prices of imported inputs and the responses of other countries.
Why firms go abroad
The economist John Dunning grouped the motives for international business into four types. Market-seeking firms go abroad to reach new customers, as Cedarline would if it sold its jackets in another country. Resource-seeking firms go abroad for raw materials or labor, as mining and energy companies do and as apparel companies have done by buying from factories in Asia. Efficiency-seeking firms spread activities across countries to lower total cost, putting design in one country, assembly in another and service in a third. Strategic-asset-seeking firms buy or partner with foreign companies to gain technology, brands or talent they cannot build quickly at home.
Dunning also asked why a company would own and run operations abroad rather than simply export or license its knowledge to local firms. His answer, known as the eclectic or OLI paradigm, has three parts. The firm must have an ownership advantage, such as a brand, technology or management skill, that lets it compete with local firms despite the extra costs of operating far from home. The country must offer a location advantage, such as a large market, low costs or natural resources, that makes it worth being there. And there must be an internalization advantage: a reason why the firm is better off using its advantage itself than selling or licensing it to others, usually because contracts for knowledge are hard to write and enforce. The framework returns in lesson 8, where it helps explain the choice between exporting, licensing, joint ventures and wholly owned subsidiaries.
Some companies are international from the start. Researchers call them born globals: young firms, often in software or specialized products, that sell in many countries within a few years of founding because their customers are spread thinly across the world. Kestrel Analytics is one; its first paying customer was a retailer in the Netherlands. Most companies, however, internationalize gradually, as a well-known Swedish model of the process suggests. They begin with markets that feel close, in language, culture and institutions, and with low-commitment modes such as exporting through agents, and then move to more distant markets and deeper commitments as they learn. Dr. Tan tells the cohort that both patterns appear in the cases they will study, and that the choice between them is one of the central decisions of the course.
# Approximate shares of world output in 2025: market exchange rates vs purchasing power parity
# (rounded illustrative figures, trillions of US dollars)
market = {"United States": 30.5, "China": 19.0, "European Union": 20.0, "India": 4.2,
          "Japan": 4.2, "United Kingdom": 3.8, "Canada": 2.3, "Rest of world": 31.0}
ppp    = {"United States": 30.5, "China": 40.0, "European Union": 29.0, "India": 17.5,
          "Japan": 6.8, "United Kingdom": 4.3, "Canada": 2.6, "Rest of world": 69.0}
tm, tp = sum(market.values()), sum(ppp.values())
print(f"{'Economy':<16}{'market share':>14}{'PPP share':>12}{'PPP/market':>12}")
for k in market:
    sm, sp = market[k] / tm, ppp[k] / tp
    print(f"{k:<16}{sm:>13.1%}{sp:>12.1%}{ppp[k] / market[k]:>12.2f}")
print(f"World total: {tm:.0f} at market rates, {tp:.0f} at PPP")Economy market share PPP share PPP/market United States 26.5% 15.3% 1.00 China 16.5% 20.0% 2.11 European Union 17.4% 14.5% 1.45 India 3.7% 8.8% 4.17 Japan 3.7% 3.4% 1.62 United Kingdom 3.3% 2.2% 1.13 Canada 2.0% 1.3% 1.13 Rest of world 27.0% 34.6% 2.23 World total: 115 at market rates, 200 at PPP
The ratio in the last column shows how much further a dollar of income goes in each economy. Where the ratio is high, as in India and China, prices of many local goods and services are low, so a given income buys more. For a company setting prices, that ratio is a warning: a jacket that sells easily at 300 dollars in Chicago may have a much smaller market at the same price in a country where average incomes, converted at market rates, are a fraction of those at home, even if that country's economy is large.
Measuring a company's international exposure
Companies differ greatly in how international they are, and the differences matter for strategy, risk and valuation. A simple measure is the share of revenue earned abroad. A fuller picture also counts the share of assets, employees and suppliers outside the home country, the number of countries in which the firm operates and the share of costs incurred in foreign currencies. A company can be very international on the cost side and not at all on the revenue side, as Cedarline is: it sells almost entirely at home, but nearly all of its products are made in Vietnam, Bangladesh and China and paid for in US dollars. That company is exposed to exchange rates, tariffs, shipping disruptions and the labor practices of its suppliers even though it has never opened a store abroad.
| Cohort member | Organization | Main international exposure in 2026 |
|---|---|---|
| Daniel Osei | Northfield Components | Steel and aluminum inputs; customers in Canada and Mexico; tariff changes |
| Hana Kowalski | Lakeview Health | Nurses recruited from abroad; imported medical supplies |
| Leo Brandt | Kestrel Analytics | European customers; data protection rules; currency on euro contracts |
| Owen Tremblay | Prairie Ridge Energy | Gas and power prices set by world markets; equipment from Europe and Asia |
| Grace Mwangi | Second Ascent | Parts from Asian suppliers; cross-border shipping of repaired gear |
The course ahead
Dr. Tan outlines the term. The first half explains the forces that shape international business: why countries trade, how trade policy and agreements work in a fragmenting world, how exchange rates move, how institutions and culture differ, and how they affect what a company can do. The second half turns to decisions: how to choose markets, how to enter them, how to organize and staff a multinational, how to design supply chains when geopolitics matter, and how to manage political, currency and compliance risks. The capstone asks the cohort to bring the course together in a recommendation for Cedarline Outdoor, which, after the strategy work of MBA-514, is considering its first serious move into foreign markets.
She closes with a caution. International business is full of confident predictions that turned out wrong: that the internet would make distance irrelevant, that China's rise would bring political liberalization, that supply chains would always choose the lowest cost. The managers who did best, she says, were not those who predicted correctly but those who built options that would pay off under several futures and kept learning as the world changed.
Worked problem
How international is Cedarline?
In fiscal 2026 Cedarline earned 468 million dollars in revenue, almost all at home, with about 3 percent from online orders shipped abroad. Its cost of goods sold was 235 million dollars, of which about 88 percent was paid to factories in Asia in US dollars. Its 62 stores, distribution center and head office are all in the United States. Describe Cedarline's international exposure using the measures in this lesson.
Show solution
- Revenue abroad: about 3 percent of 468 million, roughly 14 million dollars. On the revenue side, Cedarline is a domestic company.
- Foreign-currency costs: about 88 percent of 235 million, roughly 207 million dollars, paid in US dollars, so the currency of payment matches its revenue, but supplier prices still respond to local costs and currencies in Asia.
- Supplier exposure: nearly all production is in three Asian countries, so tariffs, shipping disruptions, labor standards and political risk in those countries affect Cedarline directly.
- Assets and employees abroad: none, apart from a small sourcing office arrangement with an agent in Asia.
Answer: Cedarline is domestic in its sales but global in its costs and supply chain. Any plan for international expansion will add revenue exposure to an existing cost exposure, and the course will show how the two can partly offset each other.
Common mistakes
MistakeGlobal business matters only for companies that export.
InsteadAny firm that imports inputs, borrows abroad, hires from abroad or faces foreign rivals is exposed to the world economy.
MistakeGlobalization is either advancing or reversing.
InsteadFlows are being redirected along geopolitical lines rather than simply rising or falling; measure each flow separately.
MistakeThe size of an economy at market exchange rates shows how many customers can afford a product.
InsteadCompare income per person, price levels and the distribution of income, not just total output.
MistakeCompanies must internationalize gradually.
InsteadMany do, but born globals sell in many countries early when their customers are spread across the world.
Summary and key terms
- Globalization is integration through flows of goods, services, investment, people, data and ideas, which are linked and adjust to one another.
- After waves of globalization from 1870 to 1914, after 1945 and after 1990, trade has since 2018 been redirected along geopolitical lines.
- The IMF expected world growth of about 3.1 percent in 2026 and 3.4 percent in 2027; the WTO expected merchandise trade volume growth of about 3.9 percent in 2026, led by goods for artificial intelligence.
- Market exchange rates and purchasing power parity give different pictures of economic size; both matter for market choice.
- Firms go abroad to seek markets, resources, efficiency or strategic assets; the OLI paradigm explains when they own operations abroad.
- A company's international exposure includes its costs, suppliers and currencies as well as its foreign revenue.
- Globalization
- The growing integration of national economies through cross-border flows.
- Foreign direct investment
- Investment that gives a company control of operations in another country.
- Purchasing power parity
- A conversion of incomes that adjusts for differences in price levels between countries.
- Fragmentation
- The redirection of trade and investment along geopolitical lines.
- OLI paradigm
- Dunning's explanation of multinational activity based on ownership, location and internalization advantages.
- Born global
- A firm that sells in many countries soon after founding.
Practice problems
Work each problem on paper first, then reveal the answer to check.
A country's output is 2 trillion dollars at market exchange rates and 5 trillion at purchasing power parity. What does the difference suggest?
Show answer
Local prices are low relative to prices in the reference country, so incomes buy much more locally than market exchange rates imply; a company pricing at home levels would find a smaller market than total output suggests.
Give one example of each of Dunning's four motives using the cohort's organizations.
Show answer
Market seeking: Kestrel selling to European retailers. Resource seeking: Lakeview recruiting nurses abroad. Efficiency seeking: Cedarline's sourcing from Asian factories. Strategic asset seeking: Prairie Ridge buying a stake in a foreign technology developer.
Why might a tariff on finished goods lead to more foreign direct investment?
Show answer
A company that can no longer export competitively into the protected market may build or buy production inside it, replacing trade with investment.
Why did Dr. Tan describe the current period as managed openness rather than deglobalization?
Show answer
Trade and investment continue to grow, but governments intervene more often through tariffs, sanctions and controls, and flows are redirected rather than stopped.
Lesson quiz · 5 questions
Score 60% or more to complete this lesson.
Create a free account to save your progress, take quizzes and earn a certificate.