
ARCH-510 · Lesson 2 of 12 · 22 min
Weather data
Holm opens the second seminar by projecting a file that looks like nothing at all: a few header lines, then 8,760 rows of comma-separated numbers. 'This is the most important input to every energy model you will ever run, and the one architects look at least,' he says. It is the weather file for Minneapolis: one row for every hour of a year, each giving the dry-bulb temperature, dew point, humidity, pressure, wind speed and direction, cloud cover and several kinds of solar radiation. Every simulation of the hub, from heating energy to daylight to overheating, starts from a file like this. 'If the weather is wrong, nothing downstream can be right.'
What a weather file contains
Simulation programs read hourly weather in standard formats, the most common being the EnergyPlus weather format (EPW). Each hour records the variables that drive heat flow and light in a building.
| Variable | Used for |
|---|---|
| Dry-bulb temperature | Conduction through the envelope, ventilation and infiltration loads, heat pump performance |
| Dew point and relative humidity | Latent loads, humidification and dehumidification, condensation risk |
| Atmospheric pressure | Air density and psychrometric calculations |
| Global horizontal radiation | Solar gain on roofs and photovoltaic output |
| Direct normal radiation | Sun striking windows and walls; shading calculations; daylight from the sun |
| Diffuse horizontal radiation | Light and heat from the sky dome |
| Illuminance values, if present | Daylight simulation; otherwise derived from radiation with luminous efficacy models |
| Wind speed and direction | Infiltration, natural ventilation, convection at exterior surfaces |
| Sky cover and sky temperature | Long-wave radiation from roofs to the night sky |
| Snow depth, if present | Ground reflectance, which affects winter daylight and solar gain |
Holm points out two things that students often miss. First, solar radiation is split into direct and diffuse parts, and the split matters as much as the total: a clear winter day on the Prairies, with low sun and intense direct radiation, behaves very differently from an overcast day with the same total. Second, snow raises ground reflectance from about 0.2 to as much as 0.7 or more, which adds a great deal of reflected light and solar gain to windows in a Prairie or Midwest winter. A weather file without snow information, or a program that ignores it, will underestimate winter daylight and solar gain.
Typical years
A single real year is a poor basis for design, because any particular year may be unusually warm or cold, sunny or dull. Simulation therefore uses a typical year assembled from many real ones. The usual method, developed in the United States in the 1970s, picks for each calendar month the real month from a long record, often 15 to 30 years, whose statistics are closest to the long-term statistics for that month. January might come from 1998, February from 2011, and so on, with the joins smoothed. The result is a year that is typical month by month while still containing the real day-to-day weather of actual months.
In the United States, the typical files most often used are TMY3, produced by the National Renewable Energy Laboratory from records of 1976 to 2005, and the newer TMYx files assembled by the Climate.OneBuilding project from more recent data. ASHRAE also publishes the International Weather for Energy Calculations (IWEC) for locations outside North America. Typical files come from airport stations, which may differ from the building's site: an airport on open land at the edge of a city is cooler at night and windier than a dense neighborhood with its urban heat island.
A typical year is typical, which means it contains few extremes. It is the right file for annual energy use and for comparing options, but the wrong one for sizing equipment or testing resilience. For those questions the designer needs design conditions, such as the temperature exceeded only 0.4 hours in 100 in summer or the temperature colder than which only 0.4 hours in 100 fall in winter, the so-called 99.6 heating design temperature, and extreme years.
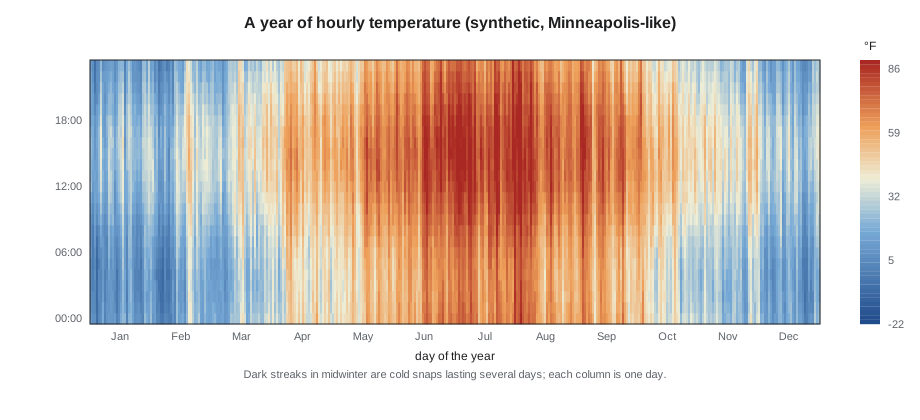
Holm's favorite way to look at a weather file is the heat map: 365 columns of 24 cells, shaded by temperature. It shows at a glance the length of the heating season, the daily swing, the persistence of cold snaps and the number of warm nights, which matter more for overheating than warm afternoons. He makes the students draw heat maps of temperature, solar radiation and wind before they run any model, and asks them to say in words what the building will have to cope with.
Degree-days and design temperatures
Many quick calculations use statistics derived from the hourly file. Heating degree-days sum, over every day of the year, how far the day's mean temperature falls below a base temperature, usually 65 °F. Cooling degree-days do the same above the base. Design temperatures summarize the extremes.
The students write a short program that builds a synthetic year of hourly temperatures, with a seasonal curve, a daily swing and random weather systems that persist for several days, and then calculates its degree-days and design temperatures. The synthetic year is not a substitute for a real weather file, but building one shows what a weather file is made of. The same program then applies a simple future shift, of the kind used to create future weather files.
# A synthetic year of hourly temperatures, its statistics, and a simple future shift
import math, random
random.seed(510)
MEAN, SWING, DAILY = 7.8, 16.5, 5.0     # annual mean, seasonal half-range, daily half-range (C)
temps = []
anom = 0.0
for h in range(8760):
    day = h // 24; hour = h % 24
    anom = 0.97 * anom + random.gauss(0, 1.15)           # weather systems that persist for days
    t = MEAN - SWING * math.cos(2 * math.pi * (day - 15) / 365) - DAILY * math.cos(2 * math.pi * (hour - 3) / 24) + anom
    temps.append(t)

def stats(ts):
    daily = [sum(ts[d * 24:(d + 1) * 24]) / 24 for d in range(365)]
    hdd = sum(max(18.0 - t, 0) for t in daily)
    cdd = sum(max(t - 18.0, 0) for t in daily)
    s = sorted(ts)
    return hdd, cdd, s[int(0.004 * 8760)], s[int(0.996 * 8760)]

def morph(ts, shift, stretch):
    """Shift every hour and stretch it about its month's mean (the approach behind morphed weather files)."""
    out = []
    for m in range(12):
        chunk = ts[m * 730:(m + 1) * 730]
        mu = sum(chunk) / len(chunk)
        out += [t + shift + stretch * (t - mu) for t in chunk]
    return out

for label, ts in (("present", temps), ("2050s shift", morph(temps, 2.6, 0.06))):
    hdd, cdd, cold, hot = stats(ts)
print(f"{label:12s} HDD {hdd * 1.8:6.0f} CDD {cdd * 1.8:5.0f} 99.6 cold {cold * 1.8 + 32:6.1f} F 0.4 hot {hot * 1.8 + 32:5.1f} F")present HDD 7617 CDD 929 99.6 cold -3.9 F 0.4 hot 95.6 F 2050s shift HDD 6441 CDD 1462 99.6 cold -0.5 F 0.4 hot 101.4 F
The synthetic Minneapolis year has about 7,600 heating degree-days in °F, close to the real figure of roughly 7,500, and about 930 cooling degree-days. Its 99.6 heating design temperature, about −4 °F, is milder than the real value of about −13 °F, and Holm asks why. Ingrid sees it: the random part of the synthetic weather is symmetric, so cold snaps are no deeper than warm spells. Real Prairie winters are not symmetric; outbreaks of Arctic air drive temperatures much further below the average than warm spells rise above it. A model fed symmetric weather would undersize the backup heat the hub's heat pumps need on the coldest nights, the very problem the students met in Environmental Systems II.
Future weather
A building designed today will operate for sixty years or more in a climate that is already changing. A typical year built from the records of 1990 to 2020 describes a climate that is passing. Designers increasingly test buildings with future weather files, created by adjusting historical files to match the projections of climate models.
The simplest method, called morphing, shifts and stretches each hour of a historical typical year so that its monthly means and ranges match a projected future climate. The temperature for hour h of month m becomes the original value plus the projected change in the monthly mean, plus a stretch of its deviation from the monthly mean.
In the students' program, a shift of 4.7 °F with a small stretch cuts heating degree-days by an eighth or more and raises cooling degree-days by more than half; the hot design temperature rises by more than 5 °F. Morphing keeps the real sequence of weather, which is its strength and its weakness: it cannot create heat waves longer or more frequent than those in the original record, only hotter versions of them.
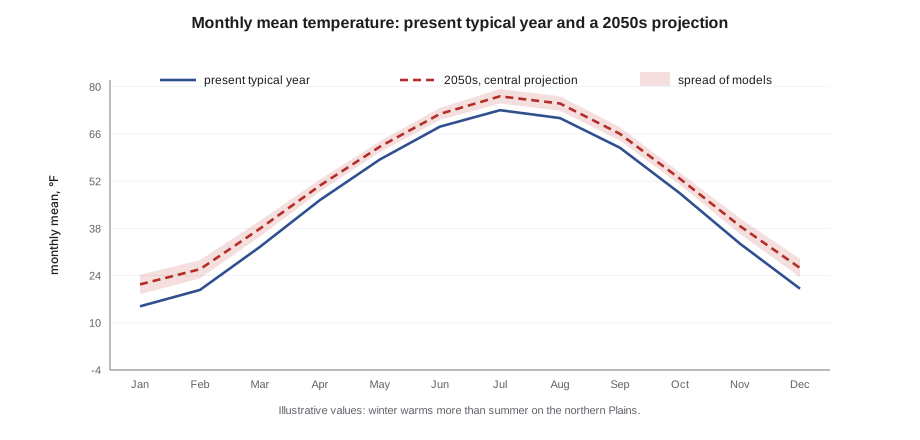
American designers usually create future files themselves, by morphing TMY3 or TMYx files with tools such as the WeatherShift method or the CCWorldWeatherGen tool, or obtain them from research groups and some city climate programs. ASHRAE has begun to discuss future climate data for design conditions, but in the mid-2020s the standards still rely mainly on historical records. Holm prefers files organized by warming level, because they separate two uncertain questions: how much the world will warm, and what that warming means for a given city.
Extreme years and resilience
For resilience questions the team needs weather that tests the building rather than describes its average year. The National Research Council's extreme warm and extreme cold years were built for this purpose; elsewhere designers select the hottest or coldest real year in the record or construct a heat wave. Sethi, who joins this seminar, describes a recent study for a seniors' residence: the typical year showed no overheating at all, but a morphed 2050s year and a real heat-wave week each showed several days above safe limits in the top-floor apartments. 'If I had only run the typical year, I would have reported that the building was fine.'
She adds a practical caution: a model run with a hot future file will report higher cooling energy, and clients sometimes conclude that the design is worse. The right comparison is between design options run with the same future weather. The point of future files is not to predict next year's bill but to make sure the building chosen today will still work when the climate changes.
Microclimate
The weather at the airport is not the weather at the building. A dense site may be 4 to 5 °F warmer at night than the open airport, especially in summer; a site by the river may be windier and more humid; a building may be shaded by its neighbors for much of the winter. Advanced tools can adjust weather files for the urban heat island and model shading by surrounding buildings in detail. At minimum, the designer should know how the site differs from the weather station and test whether the difference changes the conclusions.
Worked problem
Choosing weather for three questions about the hub
Wren must run three studies for the hub: annual energy use for the net-zero claim; the size of backup heat for the coldest nights; and the risk of overheating in the reading room when it serves as a neighborhood cool room. Which weather should she use for each?
Show solution
- Annual energy use: the current typical year (TMYx) for the main result, plus a 2050s future file to show how use and generation will change.
- Backup heat: design heating conditions for the 99.6 cold temperature and, better, a sequence of real cold-snap days, because heat pump capacity falls as the temperature drops and a building's mass carries it through a single cold hour but not a cold week.
- Overheating: an extreme warm year or a real heat wave, and the same period in a future file, with the site's urban heat island added for night temperatures, because night cooling decides whether the room recovers.
- Record the source, period and method of every file in the report.
Answer: No single weather file answers all three questions. Wren uses three kinds: typical for energy, design and cold-snap data for sizing, and extreme and future data for overheating.
Exercise 2: reading the weather
Each student downloads the current typical weather file for Minneapolis and one future file, and prepares a two-page weather study.
- Draw heat maps of temperature and global solar radiation for both files.
- Calculate heating and cooling degree-days and the design temperatures from each.
- Find the coldest five-day period and the warmest five-night period in each file.
- Describe in a paragraph what the hub must cope with, now and in the 2050s.
Self-critique checklist
- Have I matched the weather file to the question?
- Have I stated each file's source, period and method?
- Have I considered how the site differs from the weather station?
- Have I compared options under the same weather?
Common mistakes
MistakeUsing a typical year to size equipment or test resilience.
InsteadUse design conditions, extreme years and real cold snaps or heat waves for those questions.
MistakeTreating an airport weather file as the site's weather.
InsteadConsider the urban heat island, wind exposure and shading at the site.
MistakeIgnoring the split between direct and diffuse radiation.
InsteadCheck both; they drive solar gain and daylight very differently.
MistakeConcluding that a design is worse because a future file shows higher cooling.
InsteadCompare options under the same weather; future files test robustness, not bills.
MistakeUsing one future file as a forecast.
InsteadTreat future files as scenarios and test more than one where the decision depends on it.
Summary and key terms
- Every simulation starts from hourly weather: temperature, humidity, pressure, direct and diffuse radiation, wind and sky conditions.
- Typical years, such as TMY3 and TMYx, are assembled from typical real months; they suit annual energy use but contain few extremes.
- Heating and cooling degree-days and design temperatures summarize the weather for quick calculations and sizing.
- Future weather files, made by morphing or by downscaling climate models, test whether a design will work in the climate it will face.
- Weather must be matched to the question and adjusted, or at least questioned, for the site's microclimate.
- EPW
- EnergyPlus weather format, the most common hourly weather file format.
- Typical year
- A year assembled from the most typical real months in a long record.
- Degree-day
- A sum over days of the difference between a base temperature and the daily mean.
- Design temperature
- A temperature exceeded, or undercut, in only a small share of hours, used for sizing.
- Morphing
- Adjusting a historical weather file by shifting and stretching its values to match a projected climate.
- Global warming level
- A future climate defined by the rise in global temperature rather than by a date.
- Urban heat island
- The higher temperatures, especially at night, of dense urban areas compared with open land.
- Direct normal radiation
- Solar radiation from the sun's disc measured on a surface facing the sun.
Practice problems
Work each problem on paper first, then reveal the answer to check.
Daily mean temperatures for three days are 10, 23 and 40 °F. What are their heating degree-days to a base of 65 °F?
Show answer
55 + 42 + 25 = 122 degree-days.
Why is a typical weather year unsuitable for testing passive survivability during a winter outage?
Show answer
It is built from typical months, so it contains few severe cold snaps; survivability depends on the worst sequences of cold, which need design or extreme data.
A morphing shift adds 3.6 °F to every hour of a typical year. What can this method not represent?
Show answer
Changes in the frequency, length or sequence of weather events, such as longer heat waves, because it keeps the historical sequence of days.
Why does snow on the ground matter for winter simulation?
Show answer
Snow raises ground reflectance greatly, adding reflected light and solar gain to windows and affecting daylight and heating.
What advantage do weather files organized by global warming level have over files organized by date?
Show answer
They separate the uncertainty about how much the world will warm from the question of what a given amount of warming means locally, so designers can test a chosen level directly.
Lesson quiz · 5 questions
Score 60% or more to complete this lesson.
Create a free account to save your progress, take quizzes and earn a certificate.