
ARCH-510 · Lesson 1 of 12 · 26 min
Performance-based design
The first-year graduate studio at Elmhurst School occupies the top floor of the old studio building, and on the first morning of the fall term the four students who have come through the undergraduate program together, Wren, Callum, Ingrid and Joon-ho, find a new name on the door of the seminar room: Dr. Anders Holm. Holm is a building performance researcher. He spent twelve years in a university simulation laboratory in Copenhagen, where he worked on daylight and comfort models for schools, and six more in a consulting practice in Chicago that ran energy, daylight and carbon simulations for architects. He begins with a question rather than a lecture. 'In Environmental Systems I you estimated the hub's daylight factor with a formula, and in Sustainable and Regenerative Design you took the same building to net-zero carbon with spreadsheets. How sure are you that those numbers are right?' Ingrid, who wrote the hub's environmental strategy two years ago, answers honestly: 'Sure enough to choose between options. Not sure enough to promise the client a bill.' Holm nods. 'That is the right answer. This course is about how to become more sure, and about knowing when you cannot.'
The course and its approach
Advanced Building Performance and Simulation is the course in the master's year that turns the rules of thumb of the earlier environmental courses into numerical models. It builds on Environmental Systems I and II, on Building Envelope and Detailing, on Sustainable and Regenerative Design, and on the digital tools the students first met in Digital Design and BIM. The aim is not to turn architects into engineers. It is to make them competent and critical users of simulation: able to set up a model, to ask it the right question, to read its results, to recognize when it is wrong, and to explain to a client what it can and cannot tell them.
The course has three movements. Lessons 1 to 5 deal with the foundations of whole-building energy simulation: what performance-based design is, the weather data every simulation starts from, how energy models work inside, how buildings are divided into thermal zones, and how inputs for the envelope and systems are chosen and tested. Lessons 6 to 9 turn to the other kinds of simulation an architect commissions or runs: daylight, glare and visual comfort, thermal comfort, and airflow, from simple network models to computational fluid dynamics (CFD). Lessons 10 to 12 cover whole-building life cycle assessment, the calibration of models against measured data and the treatment of uncertainty, and finally a simulation project in which each student takes one building through a complete performance study.
The running case is a building the students know very well: the community hub at the corner of Lowry Avenue and Marlow Street, which they designed in second year, gave an environmental strategy in Environmental Systems I and took to net-zero operational carbon in Sustainable and Regenerative Design. Its current design has a Passive House envelope, all-electric heat pumps, a large roof array and a target energy use intensity of about 18 kBtu per square foot. Holm's challenge is simple: test that design properly.
What performance-based design means
Most buildings are still designed prescriptively. The architect follows rules that say what to build: walls of a given thermal resistance, windows of a given U-value, no more than a given share of glazing, lighting power below a given density. Prescriptive rules are easy to check and usually lead to adequate buildings, but they do not say how well the building will actually perform, and they can forbid good ideas that the rule writers did not anticipate. A reading room with more glass than the prescriptive limit may use less energy than one with less, if the glass brings daylight that lets the lights stay off and solar heat that the slab stores for the evening.
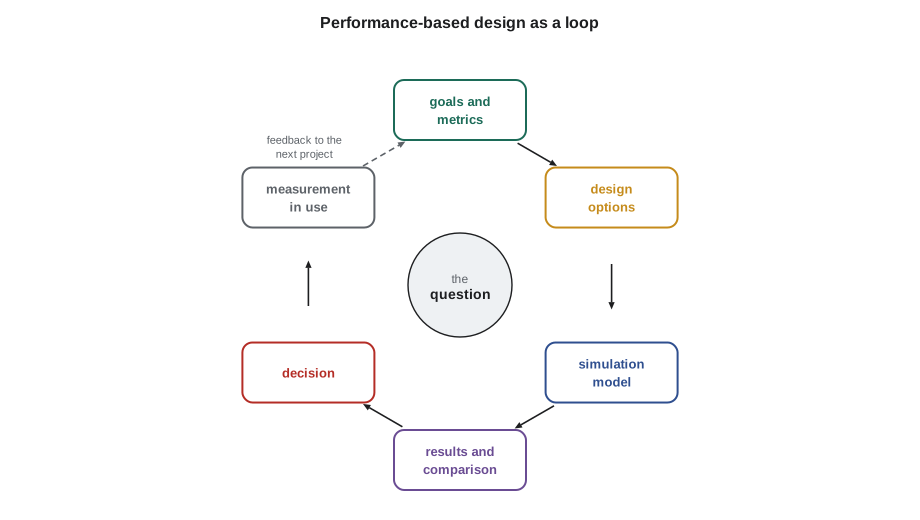
Performance-based design starts from the outcome instead. The team agrees on measurable goals, such as an energy use intensity, a share of the floor with useful daylight, a limit on overheating hours or an upfront carbon budget, and then uses simulation to test whether each design option meets them. The building codes allow this route: the energy standard ASHRAE 90.1 offers the Energy Cost Budget method and, since 2016, the Performance Rating Method of Appendix G, in which the proposed design is modeled and compared with a baseline building; many states and green building programs use Appendix G. Rating systems such as LEED and Passive House work in a similar way.
Simulation answers questions
Holm's first rule is that a simulation is built to answer a question, not to describe a building. The same hub can be represented by a model with one thermal zone or with sixty, with a typical weather year or with thirty years of future weather, with a simple daylight factor or with an annual climate-based daylight simulation. Which representation is right depends entirely on the question. 'Will the reading room overheat in a 2050s heat wave?' needs hourly weather for a hot future year, an accurate model of the reading room's glazing and mass, and a model of how people open windows. 'Is triple glazing worth its cost over double glazing for the hub?' needs a reasonable whole-building model and an annual run, but not a detailed comfort model.
He writes the stages of a useful simulation on the board, and the students copy them into the first page of their notebooks.
- Frame the question: what decision does it inform, who will make it, and by when?
- Choose metrics and criteria that answer it: energy use intensity, peak load, hours above a comfort limit, spatial daylight autonomy, upfront carbon.
- Choose the simplest model that can answer it, and state what it leaves out.
- Gather inputs and record their sources: weather, geometry, constructions, schedules, systems.
- Check the model: sanity checks, comparison with benchmarks and hand calculations.
- Run the options, including the ones that may lose.
- Test how sensitive the answer is to the inputs you are unsure of.
- Report results with their assumptions, uncertainty and limits.
The students recognize several of these steps from earlier courses. What is new is the emphasis on checking and on uncertainty. Simulation tools will always produce a number. Whether the number means anything depends on the person running the tool.
A short history of building simulation
Building energy simulation grew out of the 1960s and 1970s, when engineers began using computers to calculate heating and cooling loads hour by hour. After the oil crises of the 1970s, governments funded programs to predict annual energy use, and the United States Department of Energy's DOE-2 and the military's BLAST became the standard tools of the 1980s and 1990s. In the late 1990s the two lines were merged into a new open-source engine, EnergyPlus, first released in 2001. It is now the most widely used simulation engine in North America: many commercial and free interfaces, including OpenStudio, DesignBuilder and the Honeybee plug-ins of Ladybug Tools, use it underneath. EnergyPlus is updated twice a year; version 26.2 was released in September 2026. It was developed for years at the National Renewable Energy Laboratory, which the Department of Energy renamed the National Laboratory of the Rockies in December 2025.
Daylight simulation followed its own path. Greg Ward's Radiance, begun at the Lawrence Berkeley National Laboratory in the 1980s, uses backward ray tracing to calculate light in physically correct units, and it underlies most of the daylight tools architects use, from ClimateStudio and Honeybee to DIVA before them. Canadian practice adds its own tools: REM/Rate and Ekotrope for houses rated for energy programs, and eQUEST, an interface to the older DOE-2 engine that many firms still use for quick studies.
Holm points out that these tools are only as good as their validation. The engines are tested against analytical solutions, against each other, and against measured data, using test suites such as ASHRAE Standard 140, which compares programs on standard test buildings. Passing such tests means the engine solves its equations correctly. It does not mean a particular model of a particular building is correct; that depends on its inputs, which is the subject of most of this course.
Design space and trade-offs
Performance-based design rarely has a single right answer. A better wall costs more money and carbon to make; more glass brings more daylight but also more heat loss and glare risk; a bigger roof array covers more of the energy use but shades a roof garden. Simulation lets the team explore a design space, the set of combinations of options, and find the options that are not beaten on every count. Economists call these options efficient, or Pareto optimal: an option is on the front if no other option is better on one criterion without being worse on another.
Holm asks the students to build the simplest possible version of this exploration for the hub's envelope: three wall options, two kinds of glazing and three window shares, judged on energy use intensity and on the upfront carbon of the walls and windows. The energy model is deliberately crude, a degree-day estimate with rough allowances for solar gain and daylight, but it shows the logic.
# Explore a small design space for the hub and keep the options that are not beaten on both counts
import itertools

AREA = 2458.0          # floor area, m2
HDD = 4300            # heating degree-days, base 18 C
WALL = 2200.0; ROOF = 1500.0; WWR_OPTIONS = (0.20, 0.30, 0.40)
walls = {"R-28": 5.0, "R-40": 7.0, "R-51": 9.0}   # wall options and their thermal resistance, m2K/W
windows = {"double": 1.6, "triple": 0.8}                      # window U, W/m2K
kg_wall = {"R-28": 18.0, "R-40": 24.0, "R-51": 31.0}   # upfront carbon per m2 of wall
kg_win = {"double": 55.0, "triple": 75.0}                     # upfront carbon per m2 of window
results = []
for (wname, rsi), (gname, u), wwr in itertools.product(walls.items(), windows.items(), WWR_OPTIONS):
    a_win = WALL * wwr; a_wall = WALL - a_win
    ua = a_wall / rsi + a_win * u + ROOF / 9.0 + 0.10 * AREA   # last term: air leakage and ventilation after recovery
    heat = ua * HDD * 24 / 1000 / AREA                          # kWh per m2 before gains
    solar = 170.0 * wwr * WALL * 0.35 / AREA                    # useful winter solar gain, kWh per m2
    light = 14.0 - 24.0 * min(wwr, 0.32)                         # electric lighting falls as daylight rises
    eui = max(heat - solar, 0) / 2.6 + light + 30.0             # heat pump seasonal COP 2.6, plus 30 for everything else
    carbon = (a_wall * kg_wall[wname] + a_win * kg_win[gname]) / AREA
    results.append((round(eui, 1), round(carbon, 1), wname, gname, wwr))
front = [r for r in results if not any(o[0] <= r[0] and o[1] <= r[1] and o != r for o in results)]
print(f"options tested: {len(results)}")
print("options not beaten on both energy and upfront carbon:")
for eui, carbon, w, g, wwr in sorted(front):
    print(f"  {w}, {g} glazing, window share {wwr:.2f}: EUI {eui * 0.317:5.1f} kBtu/ft2, envelope carbon {carbon * 0.0929:5.1f} kg/ft2")
best = min(results)
print(f"lowest EUI: {best[2]}, {best[3]}, window share {best[4]:.2f} -> {best[0] * 0.317:.1f} kBtu/ft2")options tested: 18 options not beaten on both energy and upfront carbon: R-51, triple glazing, window share 0.40: EUI 15.4 kBtu/ft2, envelope carbon 4.0 kg/ft2 R-51, triple glazing, window share 0.30: EUI 15.4 kBtu/ft2, envelope carbon 3.7 kg/ft2 R-40, triple glazing, window share 0.30: EUI 15.7 kBtu/ft2, envelope carbon 3.3 kg/ft2 R-28, triple glazing, window share 0.30: EUI 16.1 kBtu/ft2, envelope carbon 2.9 kg/ft2 R-40, triple glazing, window share 0.20: EUI 16.3 kBtu/ft2, envelope carbon 2.8 kg/ft2 R-28, triple glazing, window share 0.20: EUI 16.8 kBtu/ft2, envelope carbon 2.4 kg/ft2 R-28, double glazing, window share 0.20: EUI 18.6 kBtu/ft2, envelope carbon 2.1 kg/ft2 lowest EUI: R-51, triple, window share 0.40 -> 15.4 kBtu/ft2
In Minneapolis's milder climate, 7 of the 18 options are on the front, and a window share of 0.30 appears in most of them, because the daylight and winter sun it brings outweigh its extra heat loss. The lowest EUI, about 15.4 kBtu/ft², comes from the R-51 wall, but stepping down to R-40 or R-28 costs only about 0.3 to 0.7 kBtu/ft² a year while saving 0.4 to 0.8 kg/ft² of envelope carbon. Choosing among the options on the front is not a calculation. It depends on how the team weighs energy against upfront carbon, cost and architecture, which is exactly where the architect's judgment belongs.
Callum is uneasy: 'The model is so simple. Can we trust the front?' Holm's answer sets the tone of the course. 'Not in detail. The model tells you the shape of the trade-off and roughly where the front lies. Before you show it to a client you would run a proper simulation of the options near the front, and you would test whether the front moves when you change the inputs you are unsure about. That is Lesson 5.'
Where simulation fits in the design process
Simulation is most valuable early, when decisions about form, orientation, massing, window placement and structure are still open and cheap to change, and least used then, because the design is still vague. Holm shows a familiar curve: the ability to influence performance is highest at the concept stage and falls steeply, while the cost of changes rises. Early studies use simple models and ask comparative questions: is a bar or a courtyard better for daylight, does a north monitor beat a light shelf? Later studies use detailed models to size systems, check code compliance and verify targets. After occupancy, measured data can calibrate the model, which then becomes a tool for operating the building and a lesson for the next project.
In practice the architect and the energy modeler work side by side. Priyanka Sethi, the energy modeler who has advised the students' projects since second year, visits the first seminar to describe her own work. On a typical project she builds a massing model in the first weeks of concept design, runs dozens of variants overnight, and brings the architects a one-page chart rather than a thick report. 'The worst thing I can do is arrive late with a precise answer to a question nobody is asking any more,' she says. 'The best thing is to arrive early with a rough answer to the question they are about to decide.'
Metrics: choosing what to measure
A performance target needs a metric, a number that can be calculated and compared, and a criterion, the value that counts as success. The course uses many metrics, and Holm insists that each one be defined precisely.
| Domain | Metric | Example criterion |
|---|---|---|
| Energy | Energy use intensity (EUI), site or source | 19 kBtu/ft² a year or less |
| Carbon | Operational GHG intensity; upfront carbon (A1 to A5) | Below a program limit; under 23 kg CO₂e/ft² |
| Peak load | Design heating and cooling load | Fits the heat pumps chosen |
| Daylight | Spatial daylight autonomy (sDA) and annual sunlight exposure (ASE) | sDA300/50 of at least 0.55 of the floor; ASE no more than 0.10 |
| Glare | Daylight glare probability (DGP), glare autonomy | DGP below 0.40 for most occupied hours |
| Comfort | Hours outside a comfort band; PMV/PPD | No more than a set share of occupied hours above the adaptive limit |
| Resilience | Hours of safe temperature during an outage | Above a safe minimum for 72 hours in winter |
He adds one more rule: agree the metrics and criteria before running the model. If the team chooses metrics after seeing results, it is tempting to pick the ones that make a favored option look good.
Worked problem
Framing a question for the hub
The hub's client, the city's facilities department, asks: 'Is the new design really net zero?' Joon-ho must turn this into simulation questions. How should he frame them?
Show solution
- Clarify the claim: net-zero operational carbon over a year, the definition used in Sustainable and Regenerative Design, means renewable generation on site at least equal to annual energy use, with no combustion.
- Identify the quantities needed: annual energy use and annual on-site generation, both with credible uncertainty.
- Choose the model: a whole-building energy model with realistic schedules for the hall's evening events and the daycare's hours, run with typical and future weather; a solar model of the roof array with realistic shading and snow.
- Choose the metrics: annual EUI, annual generation per square meter, and the ratio of the two; also monthly balance, since winter generation is low.
- Identify the main uncertainties to test: plug loads, how often the hall is used, heat pump performance at low temperature, snow cover on the array.
- Decide what result would change the decision: if generation falls below use in plausible scenarios, the array or the efficiency measures must change before construction.
Answer: The client's question becomes a set of defined calculations with criteria and a list of uncertainties to test. Joon-ho reports not only whether the design is net zero in the expected case but how likely it is to remain so if the uncertain inputs turn out worse.
Exercise 1: a simulation brief
Each student writes a one-page simulation brief for one question about the hub or about their own studio project.
- State the question and the decision it informs.
- Define the metrics and criteria, and when and by whom they were agreed.
- Describe the simplest model that can answer the question, and what it leaves out.
- List the inputs, their sources and the three you are least sure of.
- Describe how you will check the model and test its sensitivity.
Self-critique checklist
- Is my question tied to a real decision?
- Did I agree my metrics before seeing results?
- Is my model as simple as possible, but no simpler?
- Have I planned how to check it and how to report its uncertainty?
Common mistakes
MistakeBuilding the most detailed model possible from the start.
InsteadBuild the simplest model that can answer the question, then add detail only where it changes the answer.
MistakeTreating the simulation result as a prediction of the energy bill.
InsteadPresent design-stage results as comparisons between options, with uncertainty, unless the model has been calibrated.
MistakeChoosing metrics after seeing the results.
InsteadAgree metrics and criteria at the start.
MistakeRunning only the preferred option.
InsteadRun the alternatives too, including options that may beat your favorite.
MistakeArriving with simulation results after the decision is made.
InsteadRun quick, rough studies early, when decisions are still open.
Summary and key terms
- Performance-based design sets measurable goals and uses simulation to test whether design options meet them, instead of following prescriptive rules alone.
- A simulation should be built to answer a specific question, with metrics and criteria agreed before results are seen.
- EnergyPlus and Radiance, both validated research engines, underlie most of the energy and daylight tools architects use.
- Design spaces have trade-offs; the options not beaten on every criterion form a front, and choosing among them requires judgment.
- Simulation is most useful early, when decisions are open, and it must be checked, tested for sensitivity and reported with its uncertainty.
- Performance-based design
- Design guided by measurable performance goals tested by simulation or measurement.
- Prescriptive path
- Code compliance by following rules for each component.
- Performance path
- Code compliance by showing through modeling that a design performs at least as well as a reference building.
- Metric
- A defined, calculable measure of performance.
- Criterion
- The value of a metric that counts as success.
- Design space
- The set of all combinations of design options considered.
- Pareto front
- The options that cannot be improved on one criterion without becoming worse on another.
- Validation
- Testing a simulation engine against analytical solutions, other programs and measured data.
Practice problems
Work each problem on paper first, then reveal the answer to check.
Why is a prescriptive window limit not always the best guide to energy use?
Show answer
More glass can bring daylight that cuts lighting energy and solar gain that offsets heating, so a design above the limit may use less energy in total; only a whole-building assessment shows this.
A client asks for 'the most accurate model possible'. How would you respond?
Show answer
Ask what decision the model must inform, then propose the simplest model that can answer it reliably, explaining that extra detail costs time and can add errors without improving the answer.
Option A has an EUI of 55 and upfront carbon of 40; option B has 57 and 30; option C has 58 and 35. Which options are on the front?
Show answer
A and B. C is beaten by B, which is better on both counts; A and B each beat the other on one criterion.
What does passing ASHRAE Standard 140 tell you about a simulation program?
Show answer
That its engine solves the standard test cases consistently with other validated programs; it does not guarantee that any particular model built with it is correct.
Why should simulation results be presented early in design?
Show answer
Because decisions about form, orientation and glazing are made early, when changes are cheap; results that arrive after those decisions can only confirm or regret them.
Lesson quiz · 5 questions
Score 60% or more to complete this lesson.
Create a free account to save your progress, take quizzes and earn a certificate.