
AERO-200 · Lesson 3 of 12 · 23 min
Lift, drag and the anatomy of an aircraft
Arjun's first real task at Prairiewind Aerospace is to check the drag estimate in the Tern's preliminary design report. Élise hands him a three-view drawing and a spreadsheet and tells him that the number at the bottom, the cruise drag, decides how big the motors must be, how much battery and fuel the aircraft must carry, and therefore almost everything else. Before he can check it, he needs to know what each part of the aircraft does, where the forces on it come from, and how engineers turn those forces into coefficients that can be compared across aircraft of any size.
The anatomy of a fixed-wing aircraft
Most fixed-wing aircraft share the same main parts. The fuselage carries the payload: passengers, crew, cargo and many systems. The wing produces lift. The empennage, or tail, keeps the aircraft stable and lets the pilot control it; it usually has a horizontal stabilizer with an elevator, and a vertical fin with a rudder. The landing gear supports the aircraft on the ground. The powerplant produces thrust: piston engines, turboprops, turbofans, or electric motors driving propellers or fans. The Tern has a high wing, which keeps the propellers clear of gravel on northern strips and makes loading easy, a conventional tail, retractable tricycle landing gear, and two wing-mounted electric motors with five-bladed propellers.
The wing carries several movable surfaces. Ailerons near the wingtips move in opposite directions to roll the aircraft. Flaps on the inboard trailing edge extend downward and backward to increase lift at low speed for take-off and landing. Some aircraft also have slats or leading-edge devices that let the wing reach higher angles before it stalls, and spoilers on the upper surface that dump lift and add drag for descent or after touchdown. Trim tabs on the control surfaces let the pilot relieve control forces in steady flight.
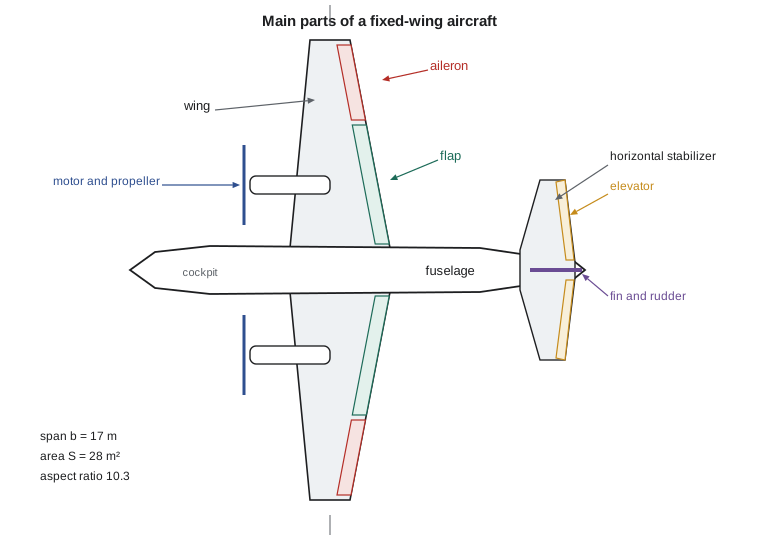
A few geometric quantities describe a wing. The span \(b\) is the tip-to-tip distance. The planform area \(S\), the wing area projected on a horizontal plane including the part inside the fuselage, is the reference area used in almost all aerodynamic coefficients. The chord is the distance from leading edge to trailing edge; the mean aerodynamic chord \(\bar{c}\) is a weighted average used for stability calculations. The aspect ratio \(AR = b^2/S\) measures how long and slender the wing is: gliders have aspect ratios above 20, airliners about 9 to 11, fighters 2 to 4. The Tern's 17 m span and 28 m² area give an aspect ratio of 10.3.
The four forces
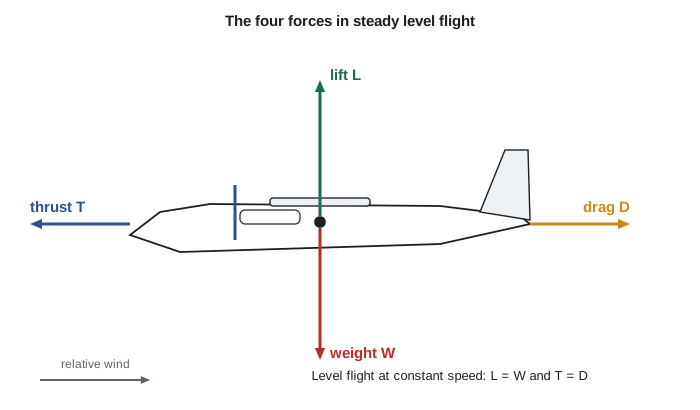
In steady, level flight four forces act on an aircraft. Lift acts perpendicular to the flight path and supports the weight. Weight acts vertically downward through the center of gravity. Thrust, from the propellers or engines, acts roughly along the flight path. Drag acts opposite to the flight path and resists motion. In steady level flight at constant speed, lift equals weight and thrust equals drag. In a climb, part of the weight acts backward along the flight path and must be overcome by extra thrust; in a turn, the lift vector tilts and must grow to keep supporting the weight.
Lift and drag are both produced by the pressure and friction forces of the air on the aircraft's surface. A wing is shaped and angled so that air flowing over its upper surface speeds up and its pressure falls, while air beneath it is slowed slightly and its pressure rises. The net pressure difference, integrated over the wing, gives an upward force. Another way to see the same physics is through momentum: the wing turns the air passing over and under it downward, and by Newton's third law the air pushes the wing up. Both descriptions are correct and give the same answer; the popular explanation that air over the top must arrive at the trailing edge at the same time as air underneath is wrong, because in reality the upper-surface air arrives first.
Dynamic pressure and coefficients
How much force can the air exert? A useful measure is the dynamic pressure, \(q = \tfrac{1}{2}\rho V^2\): the pressure rise you would get by bringing the moving air to rest. It grows with the square of speed and in proportion to density. The force on a body of reference area \(S\) is roughly proportional to \(qS\). Aerodynamicists therefore define dimensionless lift and drag coefficients that remove the effects of size, speed and density.
The lift coefficient \(C_L\) depends mainly on the shape of the wing and its angle of attack, the angle between the wing's chord and the oncoming air. Typical cruise values are 0.3 to 0.6; a wing with flaps fully down can reach 2 or more before it stalls. The drag coefficient \(C_D\) is usually 0.02 to 0.05 for a clean aircraft in cruise. Because the coefficients are dimensionless, wind-tunnel tests on a scale model can predict full-size forces, provided the flow is similar, which requires matching dimensionless groups such as the Reynolds number and Mach number.
The Reynolds number compares inertial forces to viscous forces in the flow. It decides whether the thin layer of air next to the surface, the boundary layer, stays smooth and orderly (laminar) or becomes chaotic (turbulent), and therefore strongly affects skin friction and stall. Full-size aircraft fly at Reynolds numbers of several million to tens of millions; small drones and models fly below one million, where laminar flow and early separation make wings behave noticeably differently.
Sources of drag
Drag has several components, and the drag estimate Arjun is checking adds them up. Skin-friction drag comes from the shear stress of the air rubbing on every wetted surface; it depends on the wetted area, the Reynolds number and whether the boundary layer is laminar or turbulent. Pressure drag, or form drag, comes from flow separating from the body and leaving a low-pressure wake; streamlining minimizes it. Interference drag arises where components meet, such as at the wing-fuselage junction or around engine pylons. Together these make up the parasite drag, which does not depend on lift and grows roughly with the square of speed.
Induced drag is the cost of making lift with a wing of finite span. High-pressure air beneath the wing leaks around the tips toward the low-pressure upper surface, creating trailing vortices. The vortices tilt the local airflow downward at the wing, an effect called downwash, so the lift vector tilts slightly backward and gains a rearward component. Induced drag is largest at low speed and high lift coefficient, and it falls as the aspect ratio rises, which is why gliders have long, slender wings. Wingtip devices such as winglets reduce it a little by changing how the tip vortex forms.
At high subsonic speeds a third kind appears: wave drag, caused by shock waves that form when local flow over the wing exceeds the speed of sound. Airliners use swept wings and carefully shaped supercritical airfoils to delay it. At the Tern's cruise Mach number of about 0.32, wave drag is negligible.
This drag polar sums the two main components. \(C_{D0}\) is the zero-lift drag coefficient, which collects all the parasite drag. The term \(k C_L^2\) is induced drag, plus a small part of parasite drag that also grows with lift; \(e\) is the Oswald efficiency factor, typically 0.7 to 0.85, which measures how far the wing falls short of an ideal elliptical lift distribution. The polar is the single most important equation in aircraft performance, and Lesson 8 uses it to find speeds for best range and endurance.
Worked problem
Cruise drag of the Tern
The Tern weighs 6500 kg (14,330 lb) and cruises at 380 km/h (about 205 kt) at 3000 m (9843 ft), where ρ = 0.909 kg/m³. Its wing has S = 28 m² (301 ft²) and b = 17 m (55.8 ft). Its drag polar has \(C_{D0} = 0.028\) and \(e = 0.80\). Find the cruise lift coefficient, drag coefficient, drag and lift-to-drag ratio.
Show solution
- Speed and dynamic pressure: \(V = 105.6\ \text{m/s}\), \(q = \tfrac{1}{2}(0.909)(105.6)^2 = 5066\ \text{Pa}\).
- Lift equals weight: \(C_L = W/(qS) = 63\,765/(5066 \times 28) = 0.450\).
- Induced drag factor: \(AR = 289/28 = 10.3\), \(k = 1/(\pi \times 0.80 \times 10.3) = 0.0385\).
- Drag coefficient: \(C_D = 0.028 + 0.0385(0.450)^2 = 0.0358\); drag \(D = qSC_D = 5066 \times 28 \times 0.0358 = 5.08\ \text{kN}\).
- Lift-to-drag ratio: \(L/D = 0.450/0.0358 = 12.6\).
Answer: The propellers must deliver about 5.1 kN (1140 lbf) of thrust in cruise. The aircraft's maximum L/D is about 15, but it occurs at a lower speed (about 276 km/h, 149 kt), so cruising faster costs efficiency in exchange for shorter trips. That trade-off between speed and energy use runs through all of aircraft design.
# Lift and drag of the Tern commuter in cruise
import math
rho = 0.9093          # kg/m^3, ISA at 3000 m
V = 380 / 3.6         # cruise true airspeed, m/s (380 km/h, about 205 kt)
S = 28.0              # wing reference area, m^2
b = 17.0              # span, m
m = 6500.0            # mass, kg
W = m * 9.81

q = 0.5 * rho * V**2
CL = W / (q * S)
AR = b**2 / S
CD0, e = 0.028, 0.80
k = 1 / (math.pi * e * AR)
CD = CD0 + k * CL**2
D = q * S * CD
print(f"Dynamic pressure q = {q:.0f} Pa")
print(f"Aspect ratio = {AR:.1f}, CL = {CL:.3f}")
print(f"CD = {CD0:.3f} + {k:.4f} x CL^2 = {CD:.4f}")
print(f"Drag = {D/1000:.2f} kN, L/D = {CL/CD:.1f}")

# Speed for best lift-to-drag ratio at the same weight and altitude
CL_md = math.sqrt(CD0 / k)
V_md = math.sqrt(2 * W / (rho * S * CL_md))
print(f"Best L/D = {CL_md/(2*CD0):.1f} at CL = {CL_md:.3f}, V = {V_md*3.6:.0f} km/h ({V_md*1.94384:.0f} kt)")Dynamic pressure q = 5066 Pa Aspect ratio = 10.3, CL = 0.450 CD = 0.028 + 0.0385 x CL^2 = 0.0358 Drag = 5.08 kN, L/D = 12.6 Best L/D = 15.2 at CL = 0.852, V = 276 km/h (149 kt)
Lift-to-drag ratio: the aircraft's efficiency
The ratio of lift to drag is the best single measure of aerodynamic efficiency. In level flight lift equals weight, so drag equals weight divided by L/D. An aircraft with L/D = 15 needs one unit of thrust for every 15 units of weight. Typical maximum values are about 8 to 12 for small piston aircraft, 15 to 20 for modern airliners, and 40 to 60 for high-performance gliders. A glider's L/D also equals its glide ratio: from 1000 m it can glide 50 km in still air if its L/D is 50.
Because \(L/D = C_L/C_D\), maximum L/D occurs where the line from the origin of the drag polar just touches the curve. Setting the derivative of \(C_D/C_L\) to zero shows that this happens when induced drag equals parasite drag, at \(C_L = \sqrt{C_{D0}/k}\), and the maximum value is \(1/(2\sqrt{k C_{D0}})\). Reducing parasite drag by cleaning up the shape, or reducing induced drag with a higher aspect ratio, both raise the maximum L/D. But a longer, thinner wing is heavier, so the designer must balance aerodynamic gain against structural weight, a recurring theme in Lesson 12.
Where the drag estimate comes from
Arjun's spreadsheet uses a component build-up method, standard in early design. It estimates the skin-friction coefficient of each component (fuselage, wing, tail, nacelles, landing gear fairings) from its Reynolds number, multiplies by a form factor that accounts for thickness and pressure drag, then by an interference factor and the component's wetted area. The sum, divided by the wing reference area, gives \(C_{D0}\). Small items such as antennas, gaps, rivets and cooling inlets add perhaps 5 to 10 percent more. Later in the program, computational fluid dynamics and wind-tunnel tests refine the estimate, and flight tests measure the truth.
| Tern component | Wetted area (m²) | Share of C_D0 (approx.) |
|---|---|---|
| Wing | 58 | 38 percent |
| Fuselage | 62 | 34 percent |
| Horizontal and vertical tail | 24 | 14 percent |
| Motor nacelles | 9 | 7 percent |
| Landing gear fairings, antennas, gaps, cooling | — | 7 percent |
Arjun finds one error: the spreadsheet used the sea-level Reynolds number for the wing instead of the cruise value. Correcting it changes the drag by less than 2 percent, but Élise is pleased that he checked the inputs rather than just the arithmetic. In aerospace, careful checking of assumptions is a large part of the job.
Common mistakes
MistakeUsing the wing's chord or the fuselage's frontal area as the reference area for C_L and C_D.
InsteadAircraft coefficients almost always use the wing planform area S; always check which area a coefficient is based on.
MistakeExplaining lift by equal transit times over the top and bottom of the wing.
InsteadAir over the top actually arrives first; lift comes from the pressure difference, equivalently from turning the flow downward.
MistakeThinking drag always increases with speed.
InsteadParasite drag rises with speed but induced drag falls; total drag has a minimum at the speed for maximum L/D.
MistakeTreating aspect ratio as span divided by area.
InsteadAspect ratio is span squared divided by area, b²/S.
MistakeForgetting density when comparing speeds at different altitudes.
InsteadLift and drag depend on ½ρV²; the same speed gives less force in thinner air.
Summary and key terms
- A fixed-wing aircraft has a fuselage, wing, empennage, landing gear and powerplant; ailerons, elevator and rudder control it, and flaps raise low-speed lift.
- Aspect ratio \(AR = b^2/S\) measures how slender the wing is; S is the usual reference area.
- In steady level flight lift equals weight and thrust equals drag.
- Lift and drag scale with dynamic pressure: \(L = qSC_L\), \(D = qSC_D\), with \(q = \tfrac{1}{2}\rho V^2\).
- Parasite drag (friction, form, interference) rises with speed; induced drag, the cost of lift from a finite wing, falls with speed.
- The drag polar \(C_D = C_{D0} + kC_L^2\) gives maximum L/D where induced drag equals parasite drag.
- Fuselage
- The main body of an aircraft, carrying crew, payload and systems.
- Empennage
- The tail assembly: horizontal stabilizer and elevator, vertical fin and rudder.
- Angle of attack
- The angle between the wing chord line and the oncoming airflow.
- Aspect ratio
- Span squared divided by wing area, b²/S.
- Dynamic pressure
- q = ½ρV², the pressure equivalent of the flow's kinetic energy.
- Lift coefficient
- Lift divided by dynamic pressure and reference area.
- Parasite drag
- Drag not due to lift: skin friction, form and interference drag.
- Induced drag
- Drag caused by producing lift with a wing of finite span, linked to tip vortices and downwash.
- Drag polar
- The relationship between drag coefficient and lift coefficient, often C_D = C_D0 + kC_L².
- Oswald efficiency factor
- A number, usually 0.7 to 0.85, describing how close a wing comes to ideal induced drag.
- Reynolds number
- ρVc/μ, the ratio of inertial to viscous forces in a flow.
Practice problems
Work each problem on paper first, then reveal the answer to check.
A wing has a span of 12 m and an area of 16 m². Find its aspect ratio.
Show answer
AR = 144/16 = 9.
Find the dynamic pressure at 300 km/h at sea level.
Show answer
V = 83.3 m/s; q = ½(1.225)(83.3)² = 4.25 kPa.
A 1200 kg aircraft with S = 16 m² flies at 60 m/s at sea level. Find C_L.
Show answer
q = 2205 Pa; C_L = 11 772/(2205 × 16) = 0.334.
For C_D0 = 0.030, e = 0.75 and AR = 8, find k and the maximum L/D.
Show answer
k = 1/(π × 0.75 × 8) = 0.0531; (L/D)max = 1/(2√(0.0531 × 0.030)) = 12.5.
A glider with L/D = 40 is at 1500 m. How far can it glide in still air?
Show answer
40 × 1.5 km = 60 km.
In the program, increase the span to 19 m at the same area. What happens to the cruise L/D?
Show answer
AR rises to 12.9, k falls to 0.0308, C_D falls to 0.0343 and L/D rises to about 13.1.
Lesson quiz · 5 questions
Score 60% or more to complete this lesson.
Create a free account to save your progress, take quizzes and earn a certificate.