
ACCT-321 · Lesson 9 of 12 · 26 min
The balanced scorecard and strategy maps
Lessons 4 to 8 dealt with financial measures of divisional performance: ROI, residual income, EVA and the transfer prices that feed them. Financial measures are indispensable, but on their own they have well-known limitations. They report the results of past decisions rather than the drivers of future results, they can be improved in the short run by cutting investments in customers, people and processes, and they say little about whether a division is carrying out its strategy. The balanced scorecard, introduced by Robert Kaplan and David Norton in 1992, was a response to those limitations. This lesson explains the scorecard's four perspectives, the strategy map that links them, how measures are chosen, weighted and cascaded, and what research and practice have found. BUS-450 covers strategy formulation; here the focus is on translating a strategy into measures, and ACCT-421 takes strategic performance management further.
Cormorant's strategy
Cormorant's board has adopted a strategy for 2026 to 2030 built around the shift from gas water heaters to electric heat pumps. Appliances will grow heat pumps from 30 percent to half of its sales by 2030, competing on reliability and energy efficiency rather than price. Components will develop variable-speed motors and control boards that make Cormorant's heat pumps quieter and more efficient than competitors'. Services will build a network of certified technicians and a growing base of maintenance contracts, so that customers who buy a Cormorant heat pump stay with Cormorant for service. Head office wants a measurement system that shows, every quarter, whether each division is executing its part of the strategy, not only whether it earned its profit.
The four perspectives
The balanced scorecard organizes measures into four perspectives. The financial perspective asks how the business looks to shareholders: profitability, growth, return on capital and risk. The customer perspective asks how customers see the business: satisfaction, retention, acquisition, market share and the value proposition the strategy promises them. The internal business process perspective asks what the business must excel at to deliver that value proposition: operations, innovation, after-sales service and regulatory and social processes. The learning and growth perspective asks how the business will sustain its ability to change and improve: employee skills, information systems and organizational culture and alignment.
The word balanced refers to several balances: between financial and non-financial measures, between lagging indicators of outcomes and leading indicators of future performance, between internal and external perspectives, and between short-term results and long-term capability. A scorecard is not simply a list of key performance indicators. Its measures are chosen because they describe the strategy, and they are linked by hypothesized cause-and-effect relationships.
| Perspective | Question | Appliances measures | Lead or lag |
|---|---|---|---|
| Financial | How do we look to shareholders? | ROI; sales growth; heat pump share of sales | Lag |
| Customer | How do customers see us? | Net promoter score; dealer retention; heat pump market share | Mostly lag, some lead |
| Internal process | What must we excel at? | First-pass yield; warranty claims; time to market | Lead |
| Learning and growth | How do we sustain our ability to improve? | Training hours; engineer turnover; certified technicians | Lead |
Strategy maps
In later work, Kaplan and Norton developed the strategy map, a diagram that shows the strategic objectives in each perspective and the cause-and-effect links between them. The map reads from the bottom up. Investments in people, systems and culture improve internal processes; better processes deliver the customer value proposition; satisfied, loyal customers produce revenue growth and productivity, which create shareholder value. Each objective on the map has one or more measures, a target and initiatives intended to achieve it. Drawing the map forces managers to make the strategy explicit and to argue about how they believe it works, which is often more valuable than the measures themselves.
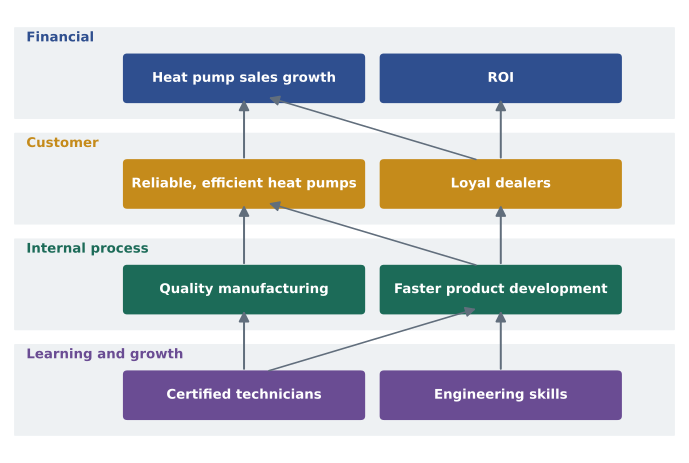
For Appliances, the map hypothesizes that certified technicians and stronger engineering skills lead to higher first-pass yield, fewer warranty claims and faster product development; that these produce a reputation for reliability and efficiency among dealers and homeowners, shown in net promoter score and dealer retention; and that loyal dealers and a strong reputation lead to heat pump market share, sales growth and, eventually, higher ROI. Each link is a hypothesis that can be tested as data accumulate.
Scoring a scorecard
Many companies summarize scorecard performance in a single score, comparing each measure with its target, capping the credit for overachievement, and weighting the perspectives. The program below does this for Appliances' 2026 results, with equal perspective weights and a cap of 120 percent. For measures where lower is better, such as warranty claims, the ratio is inverted.
# Appliances 2026 balanced scorecard: achievement against target (illustrative)
measures = [  # perspective, measure, actual, target, higher_is_better
    ("Financial", "Return on investment (%)", 15.0, 14.0, True),
    ("Financial", "Sales growth (%)", 6.0, 8.0, True),
    ("Financial", "Heat pump share of sales (%)", 30.0, 35.0, True),
    ("Customer", "Net promoter score", 42, 45, True),
    ("Customer", "Dealer retention (%)", 92.0, 90.0, True),
    ("Customer", "Heat pump market share (%)", 11.0, 12.0, True),
    ("Internal process", "First-pass yield (%)", 96.5, 97.0, True),
    ("Internal process", "Warranty claims (% of units)", 2.1, 1.8, False),
    ("Internal process", "Time to market (months)", 14, 12, False),
    ("Learning and growth", "Training hours per employee", 32, 30, True),
    ("Learning and growth", "Engineer turnover (%)", 9.0, 8.0, False),
    ("Learning and growth", "Heat pump certified technicians (%)", 60.0, 70.0, True),
]
weights = {"Financial": 0.25, "Customer": 0.25, "Internal process": 0.25, "Learning and growth": 0.25}
cap = 1.20
scores = {}
for p, m, a, t, hib in measures:
    s = min(cap, a / t if hib else t / a)
    scores.setdefault(p, []).append(s)
    print(f"{p:<20} {m:<36} actual {a:>5}  target {t:>5}  score {s:6.1%}")
total = 0
for p, lst in scores.items():
    avg = sum(lst) / len(lst)
    total += weights[p] * avg
    print(f"{p:<20} average {avg:6.1%}")
print(f"Weighted scorecard result: {total:.1%}")Financial Return on investment (%) actual 15.0 target 14.0 score 107.1% Financial Sales growth (%) actual 6.0 target 8.0 score 75.0% Financial Heat pump share of sales (%) actual 30.0 target 35.0 score 85.7% Customer Net promoter score actual 42 target 45 score 93.3% Customer Dealer retention (%) actual 92.0 target 90.0 score 102.2% Customer Heat pump market share (%) actual 11.0 target 12.0 score 91.7% Internal process First-pass yield (%) actual 96.5 target 97.0 score 99.5% Internal process Warranty claims (% of units) actual 2.1 target 1.8 score 85.7% Internal process Time to market (months) actual 14 target 12 score 85.7% Learning and growth Training hours per employee actual 32 target 30 score 106.7% Learning and growth Engineer turnover (%) actual 9.0 target 8.0 score 88.9% Learning and growth Heat pump certified technicians (%) actual 60.0 target 70.0 score 85.7% Financial average 89.3% Customer average 95.7% Internal process average 90.3% Learning and growth average 93.8% Weighted scorecard result: 92.3%
Appliances beat its ROI target, but its scorecard result is 92.3 percent, because it fell short on sales growth, heat pump share, time to market and the share of certified technicians. The pattern matters more than the overall number. Strong current profit combined with weak leading indicators in the heat pump strategy suggests the division may be harvesting its gas water heater business rather than building the new one. A purely financial evaluation would have praised the division's 15 percent ROI and missed the warning.
Weighted scores have drawbacks. They let strong performance on one measure offset weak performance on another, which may not reflect the strategy: no amount of training hours makes up for missing the heat pump share target. Weights are subjective, and managers quickly learn which measures carry the most weight and focus on them. Some companies therefore use thresholds, requiring a minimum on critical measures, or present the scorecard without a summary score and leave the overall judgment to senior management.
Worked problem
Changing the weights
Head office decides financial measures should carry 40 percent of the weight and the other three perspectives 20 percent each. What is Appliances' weighted result?
Show solution
- Perspective averages from the program: financial 89.3%, customer 95.7%, internal process 90.3%, learning and growth 93.8%.
- Weighted result: 0.40 × 89.3% + 0.20 × (95.7% + 90.3% + 93.8%).
- = 35.72% + 0.20 × 279.8% = 35.72% + 55.96% = 91.7%.
Answer: About 91.7 percent; heavier financial weighting lowers the result because Appliances missed two of its three financial targets.
Testing the cause-and-effect links
A scorecard is only as good as the links it assumes. If dealer net promoter score really leads heat pump sales, then improving it is a sensible objective; if not, the division may be measuring the wrong thing. Testing the links with data is harder than it looks, because many business series trend together over time.
# Does dealer net promoter score lead heat pump sales? Quarterly, 2024 Q1 to 2026 Q4 (illustrative)
from statistics import correlation
nps   = [30, 31, 34, 33, 36, 38, 37, 40, 41, 40, 43, 42]
sales = [2.0, 2.1, 2.1, 2.3, 2.3, 2.4, 2.6, 2.6, 2.8, 3.0, 3.0, 3.2]   # heat pump sales, $ millions
print(f"Heat pump sales in 2026: {sum(sales[-4:]):.1f} million")
d_nps = [b - a for a, b in zip(nps, nps[1:])]
d_sales = [b - a for a, b in zip(sales, sales[1:])]
for lag in range(0, 3):
    lv = correlation(nps[:len(nps) - lag], sales[lag:])
    ch = correlation(d_nps[:len(d_nps) - lag], d_sales[lag:])
print(f"Lag {lag}: levels {lv:5.2f} quarter-to-quarter changes {ch:5.2f}")Heat pump sales in 2026: 12.0 million Lag 0: levels 0.92 quarter-to-quarter changes -0.94 Lag 1: levels 0.98 quarter-to-quarter changes 0.80 Lag 2: levels 0.94 quarter-to-quarter changes -0.23
Measured in levels, net promoter score and heat pump sales are highly correlated at every lag, because both rose steadily from 2024 to 2026. That correlation says almost nothing about cause. Measured as quarter-to-quarter changes, the picture is clearer: changes in net promoter score are strongly positively correlated with changes in sales one quarter later (0.80), but not in the same quarter or two quarters later. With only twelve quarters, the evidence is suggestive rather than conclusive, but it is consistent with the strategy map's hypothesis that dealer loyalty leads sales by about a quarter. Companies with more data use regression, control for seasonality and other drivers, and look across divisions or regions to test links more rigorously.
Cascading and alignment
Scorecards can be cascaded from the corporate level to divisions, departments and teams, so that each unit's measures support the objectives above it. Cormorant's corporate objective of leadership in heat pumps becomes, for Components, a time-to-market objective for variable-speed motors and a defect-rate objective for control boards; for Services, objectives for the number of certified technicians and the renewal rate on maintenance contracts. Cascading helps align a decentralized organization, but it must leave room for local judgment: a scorecard imposed rigidly from above undermines the autonomy that lesson 2 argued decentralization requires.
Kaplan and Norton later described the strategy-focused organization, in which the scorecard becomes a management system rather than a measurement tool: it is used to communicate strategy, link budgets and initiatives to strategic objectives, align incentives, and hold regular strategy reviews separate from operational reviews. Few companies implement all of this. Many use the scorecard as an expanded set of key performance indicators, which is useful but misses the point of tying measures to strategy.
Criticisms and evidence
The scorecard has attracted substantial criticism. Hanne Nørreklit argued in 2000 that the relationships between perspectives are often logical or definitional rather than causal, and that the time lags between them are rarely specified, so the cause-and-effect claims are hard to test. Others note that four perspectives may omit important stakeholders such as suppliers, regulators, communities and the environment, a gap lesson 10 addresses. Scorecards can grow to dozens of measures, diluting attention. And managers may game non-financial measures, which are often easier to manipulate than audited financial results.
Evidence on the scorecard's effects is mixed but informative. Research by Christopher Ittner and David Larcker found that companies that tested and validated the links between non-financial measures and financial results earned higher returns than those that did not, while many companies did not attempt such validation at all. Experimental studies have found that evaluators of scorecards tend to rely on measures common to all units and underweight unique measures tied to each unit's strategy, the common-measures bias, which undermines the scorecard's purpose. And the scorecard's use in compensation, discussed in lesson 11, raises questions about subjectivity and weighting.
Common mistakes
MistakeTreating the scorecard as a list of key performance indicators.
InsteadChoose measures that describe the strategy and link them in a cause-and-effect map.
MistakeAssuming the cause-and-effect links are true.
InsteadTest them with data, using changes or regression rather than correlations of trending levels.
MistakeUsing too many measures.
InsteadKeep a small number, typically three to five per perspective, tied to strategic objectives.
MistakeRelying only on measures common to all divisions when evaluating managers.
InsteadGive weight to unique measures that reflect each division's strategy, avoiding the common-measures bias.
MistakeLetting a high summary score hide weak performance on critical measures.
InsteadLook at the pattern, and use thresholds for critical measures.
Summary and key terms
- Financial measures are lagging and can be improved by underinvesting; the balanced scorecard adds non-financial leading indicators.
- The four perspectives are financial, customer, internal business process, and learning and growth.
- A strategy map shows objectives in each perspective and the cause-and-effect links between them.
- Weighted scorecard results summarize performance but allow offsets and depend on subjective weights.
- Links should be tested with data; trending series correlate in levels even when one does not cause the other.
- Scorecards can be cascaded to align units, but should leave room for local judgment.
- Criticisms include doubtful causality, missing stakeholders, too many measures and the common-measures bias.
- Balanced scorecard
- A performance measurement framework with financial, customer, internal process, and learning and growth perspectives.
- Strategy map
- A diagram showing strategic objectives and the cause-and-effect links between them across perspectives.
- Leading indicator
- A measure that predicts future performance.
- Lagging indicator
- A measure that reports the outcome of past actions.
- Customer value proposition
- The combination of attributes a business promises its target customers.
- Cascading
- Translating corporate scorecard objectives into objectives for lower-level units.
- Strategy-focused organization
- An organization that uses the scorecard as its central management system.
- Common-measures bias
- The tendency of evaluators to rely on measures shared across units and underweight unique ones.
- Net promoter score
- The percentage of customers who would recommend a business minus the percentage who would not.
- Initiative
- A project or action intended to achieve a strategic objective on the scorecard.
Practice problems
Work each problem on paper first, then reveal the answer to check.
Rerun the scorecard program with sales growth of 9 percent. New financial average and overall result?
Show answer
Financial 101.8%; overall 95.4%.
What happens to the warranty claims score if claims fall to 1.5 percent?
Show answer
It reaches the 120 percent cap (1.8 / 1.5 = 120%).
Using the original data, compute the result with weights of 30, 30, 20 and 20 percent for financial, customer, internal process and learning and growth.
Show answer
0.3 × 89.3 + 0.3 × 95.7 + 0.2 × 90.3 + 0.2 × 93.8 = 92.3%.
Why are the correlations between levels of net promoter score and sales uninformative?
Show answer
Both series trend upward, so they correlate whether or not one causes the other.
Rerun the lag program for lags 0 to 3. What is the correlation of changes at a lag of 3 quarters?
Show answer
About −0.63, so no evidence of a three-quarter lead.
Give one leading and one lagging measure for Services.
Show answer
Leading: share of certified technicians; lagging: maintenance contract revenue (others possible).
What is the common-measures bias, and why does it matter for scorecards?
Show answer
Evaluators rely on measures shared across units, ignoring unique strategic measures the scorecard was designed to capture.
Why might a high ROI with weak leading indicators be a warning sign?
Show answer
The division may be harvesting its current business at the expense of future performance.
Name two criticisms Nørreklit made of the balanced scorecard.
Show answer
The links are often logical rather than causal, and time lags are not specified.
How could Components' scorecard support Cormorant's heat pump strategy?
Show answer
Measures such as time to market for variable-speed motors and control board defect rates.
Lesson quiz · 5 questions
Score 60% or more to complete this lesson.
Create a free account to save your progress, take quizzes and earn a certificate.