
ACCT-321 · Lesson 10 of 12 · 26 min
Non-financial and sustainability performance measures
Lesson 9 showed how the balanced scorecard links non-financial measures to strategy. This lesson looks more closely at the measures themselves: the operational measures of quality, time, productivity, customers and employees that managers use day to day, and the sustainability measures, especially greenhouse gas emissions, that boards, investors, regulators and customers increasingly expect companies to track. The focus is on their use in management control: how they are defined, what can go wrong with them, and how they can be built into targets, budgets and evaluation. ACCT-222 covers cost of quality and activity-based costing, so this lesson only refers to them. Regulatory facts are stated as of October 2026.
Why non-financial measures
Non-financial measures have three advantages for control. They are often leading indicators of financial results, as lesson 9 argued. They are closer to what operating managers can actually influence: a production supervisor can affect first-pass yield and on-time delivery directly, while divisional profit depends on many things outside their control. And they are available quickly, often daily or in real time, whereas financial results arrive monthly after the books close. Their disadvantages are the mirror image: they are not expressed in a common unit, so trade-offs between them are hard to judge; their link to value is often uncertain; they are usually unaudited and easier to manipulate; and too many of them can overwhelm managers.
| Category | Examples at Cormorant | Main user |
|---|---|---|
| Quality | First-pass yield; warranty claims per 1,000 units; customer returns | Components and Appliances plants |
| Time and delivery | Throughput time; manufacturing cycle efficiency; on-time delivery; time to market | Plants, engineering |
| Productivity | Units per labor hour; billable hours per technician; first-time fix rate | Plants, Services |
| Customer | Net promoter score; dealer retention; service contract renewals | Sales, Services |
| Employee | Turnover; training hours; safety incidents per 200,000 hours; engagement score | All divisions, human resources |
| Sustainability | Scope 1 and 2 emissions; emissions intensity; product energy efficiency; waste to landfill | Plants, head office, Appliances product design |
Quality and time measures
Components supplies control boards to Appliances and to outside customers, and its plant managers track a small set of time and quality measures. Throughput time, sometimes called manufacturing cycle time, is the total time from the start of production to completion: processing, inspection, moving and waiting in queues. Manufacturing cycle efficiency (MCE) is the ratio of value-added processing time to throughput time. First-pass yield is the share of units that pass inspection the first time; final yield includes reworked units. On-time delivery is the share of orders delivered by the promised date.
# Components: time and quality measures for control boards, 2026 (illustrative)
hours = {"processing": 2.0, "inspection": 0.5, "move": 1.5, "queue": 12.0}
throughput = sum(hours.values())
mce = hours["processing"] / throughput
print(f"Throughput time {throughput:.1f} h; manufacturing cycle efficiency {mce:.1%}")
started, good_first_time, reworked_good = 250_000, 236_250, 9_500
print(f"First-pass yield {good_first_time / started:.1%}; final yield {(good_first_time + reworked_good) / started:.1%}")
orders, on_time = 1_840, 1_712
print(f"On-time delivery {on_time / orders:.1%}")
hours["queue"] = 6.0
print(f"With queue time halved: throughput {sum(hours.values()):.1f} h; MCE {hours['processing'] / sum(hours.values()):.1%}")Throughput time 16.0 h; manufacturing cycle efficiency 12.5% First-pass yield 94.5%; final yield 98.3% On-time delivery 93.0% With queue time halved: throughput 10.0 h; MCE 20.0%
Only 12.5 percent of a board's 16 hours in the plant is spent being worked on; most of the rest is waiting. Halving queue time cuts throughput time to 10 hours and raises MCE to 20 percent, without any change in processing. That kind of insight is hard to get from cost reports, because queue time costs little directly; its costs show up as work-in-process inventory, longer lead times and slower response to customers. First-pass yield of 94.5 percent means 5.5 percent of boards need rework or are scrapped, and the gap between first-pass and final yield measures the rework burden.
Each measure creates its own incentives. A plant evaluated only on on-time delivery may build excess inventory to protect its record. A plant evaluated only on first-pass yield may slow production or tighten inspection standards selectively. Managers rewarded for short throughput times may push work out before it is ready. For this reason, operational measures are usually used in balanced sets, and their definitions, such as when an order counts as late, are fixed in advance and audited internally.
Customer and employee measures
Customer measures range from satisfaction surveys to behavioral measures such as retention, repeat purchases and contract renewals. Behavioral measures are generally more reliable because they record what customers do rather than what they say. Services tracks the renewal rate on maintenance contracts and the first-time fix rate, the share of service calls resolved on the first visit, which surveys suggest is the strongest driver of homeowners' satisfaction. Employee measures include turnover, absenteeism, training, engagement and safety. Safety is the most important for a manufacturer: Cormorant reports recordable incidents per 200,000 hours worked, the standard rate used by safety regulators, and treats any serious incident as a matter for the board rather than a number to be traded off against others.
Sustainability measures and the greenhouse gas inventory
The most widely used sustainability measures are greenhouse gas (GHG) emissions, measured in metric tons of carbon dioxide equivalent (CO2e) and classified under the Greenhouse Gas Protocol into three scopes. Scope 1 covers direct emissions from sources the company owns or controls, such as natural gas burned in its plants and fuel in its service vans. Scope 2 covers indirect emissions from purchased electricity, steam, heating and cooling. Scope 3 covers all other indirect emissions in the value chain, in fifteen categories, including purchased goods, transportation and, for a manufacturer like Cormorant, the use of products sold.
# Cormorant's 2026 greenhouse gas inventory and an internal carbon charge (illustrative)
divisions = {  # name: (scope 1 tonnes, scope 2 tonnes, sales $000, controllable margin $000)
    "Appliances": (4_200, 1_800, 40_000, 5_500),
    "Components": (1_500, 2_600, 24_000, 3_800),
    "Services":   (3_100,   200, 12_000, 1_400),
}
price = 100   # internal carbon price, $ per tonne of CO2e
total = 0
for name, (s1, s2, sales, margin) in divisions.items():
    t = s1 + s2
    total += t
    charge = t * price / 1000
    print(f"{name:<11} scopes 1+2 {t:>6,} t  intensity {t / (sales / 1000):6.1f} t per $M  "
          f"charge {charge:>5,.0f}  margin after charge {margin - charge:>6,.0f}")
print(f"Total scopes 1 and 2: {total:,} tonnes")
# Scope 3, category 11: lifetime emissions from use of products sold
gas, hp = 1.6 * 12, 0.4 * 12            # tonnes per unit over a 12-year life
for share in (0.30, 0.50):
    units_hp = 100_000 * share
    use = (100_000 - units_hp) * gas + units_hp * hp
print(f"Heat pump share {share:.0%}: use-phase emissions {use:>10,.0f} t, {use / total:,.0f} times scopes 1 and 2")Appliances scopes 1+2 6,000 t intensity 150.0 t per $M charge 600 margin after charge 4,900 Components scopes 1+2 4,100 t intensity 170.8 t per $M charge 410 margin after charge 3,390 Services scopes 1+2 3,300 t intensity 275.0 t per $M charge 330 margin after charge 1,070 Total scopes 1 and 2: 13,400 metric tons Heat pump share 30%: use-phase emissions 1,488,000 t, 111 times scopes 1 and 2 Heat pump share 50%: use-phase emissions 1,200,000 t, 90 times scopes 1 and 2
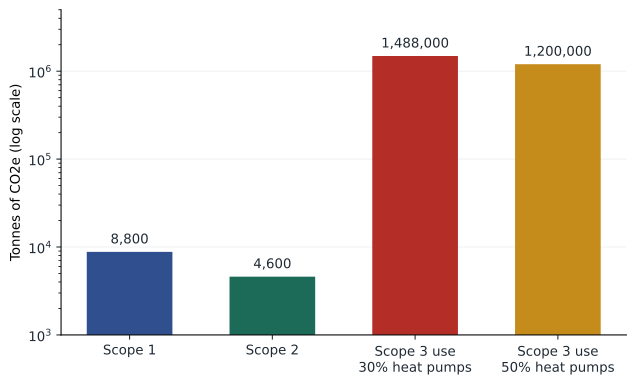
Cormorant's 2026 scope 1 and 2 emissions total 13,400 metric tons. Services has the highest intensity per dollar of sales because its fleet of vans burns fuel; Components' emissions are mostly from electricity. If Cormorant applied an internal carbon price of $100 per metric ton to scope 1 and 2 emissions, the divisions' controllable margins would fall by $330,000 to $600,000, which would focus attention on fleet electrification and plant energy efficiency.
The scope 3 figures are far larger. A gas water heater sold in 2026 will emit about 19 metric tons of CO2e over a 12-year life, a heat pump about 5 metric tons, depending on the electricity grid, using these illustrative factors. At 30 percent heat pumps, the lifetime use-phase emissions of one year's sales are about 1.5 million metric tons, more than a hundred times scopes 1 and 2. Raising the heat pump share to half cuts them by almost 300,000 metric tons. This is why Cormorant's strategy and its sustainability goals point in the same direction, and why the most important sustainability measure for Appliances is not its own plants' emissions but the efficiency and mix of the products it sells.
Internal carbon pricing
An internal carbon price puts a monetary value on emissions so that they enter decisions and performance measures alongside other costs. Companies use two forms. A shadow price is applied in capital budgeting and other decisions but not charged to divisions, so a project that increases emissions must earn enough to cover their notional cost. An internal fee is actually charged to divisions, as in the program above, and the proceeds are often used to fund emission reduction projects. The fee works like the chargebacks in lesson 2: it changes divisional profit and therefore behavior, but it must be seen as fair and controllable. Charging Services for fleet emissions makes sense because its managers choose the vehicles; charging Appliances for scope 3 use-phase emissions would not, at least as an internal fee, because those emissions depend on customers' choices and the electricity grid.
Worked problem
A shadow price in a capital decision
Services is choosing between 40 new diesel vans and 40 electric vans for 2027. Over each van's six-year life, the diesel option costs $60,000 less in total and emits 2,400 more metric tons of CO2e across the fleet. With a shadow price of $100 per metric ton, which option is preferred?
Show solution
- Shadow cost of the extra emissions: 2,400 × $100 = $240,000.
- Diesel advantage before carbon: $60,000 lower cost.
- Net comparison: the electric option is better by $240,000 − $60,000 = $180,000 once emissions are priced.
- Undiscounted figures for simplicity; a full analysis would discount cash flows and emissions costs (ACCT-421).
Answer: The electric vans, by about $180,000 at a $100 shadow price; the break-even shadow price is $60,000 / 2,400 = $25 per metric ton.
Reporting standards and regulation
In the United States, the Securities and Exchange Commission adopted climate disclosure rules in March 2024 but voted in March 2025 to end its defense of them in court, so no federal climate disclosure requirement applies to public companies. California's SB 253 requires US entities with more than $1 billion of annual revenue that do business in California to report scope 1 and 2 emissions, with the first reports due 10 November 2026 under the California Air Resources Board's rules and scope 3 reporting expected from 2027. Enforcement of the companion climate risk law, SB 261, has been enjoined by the Ninth Circuit pending appeal. Many US companies also report voluntarily using the ISSB standards or the GHG Protocol, and environmental marketing claims are subject to the Federal Trade Commission's Green Guides.
Cormorant is below the thresholds of the mandatory regimes, but its large customers, retailers and lenders increasingly ask for emissions data and targets, so its management accounting system needs to produce reliable sustainability measures whether or not regulation requires them. A useful distinction is between financial materiality, sustainability matters that affect the company's value, which is the focus of the ISSB standards, and impact materiality, the company's effects on people and the environment, which some European standards also require. Management control systems can serve both, but the measures and audiences differ.
Building sustainability into the control system
Sustainability measures become part of management control when they are given targets, built into plans and budgets, reported alongside financial results, and tied to evaluation and rewards. Cormorant's head office has set three targets for 2030: a 40 percent reduction in scope 1 and 2 emissions from 2026, half of Appliances' unit sales from heat pumps, and electrification of half of the Services fleet. Each division's annual plan includes initiatives and capital requests tied to these targets, and quarterly reviews track progress. The emissions data come from energy bills and fuel cards, and internal audit reviews the calculations each year, because unreliable data would undermine both decisions and any future external assurance.
Several problems recur. Sustainability measures can be gamed like any other: a division can cut reported emissions by outsourcing an energy-intensive process, moving emissions from scope 1 to scope 3 without any real reduction. Intensity targets, such as metric tons per million dollars of sales, can improve simply because prices rise. And linking executive pay to sustainability targets that are vague, easy or self-assessed rewards managers without changing outcomes, a problem lesson 11 returns to. Claims that a company or product is green must also be supportable, which is a reason to keep sustainability data to the same standard as financial data.
Common mistakes
MistakeTreating non-financial measures as automatically better than financial ones.
InsteadThey have their own problems: no common unit, uncertain links to value, and manipulation.
MistakeIgnoring queue and move time because they cost little directly.
InsteadTrack throughput time and MCE; waiting drives inventory and lead times.
MistakeFocusing only on scope 1 and 2 emissions for a manufacturer of energy-using products.
InsteadMeasure scope 3 use-phase emissions, which can be many times larger.
MistakeCharging divisions for emissions they cannot control.
InsteadApply internal fees to controllable emissions; use shadow prices for decisions.
MistakeUsing intensity targets without checking what drives the ratio.
InsteadCheck absolute emissions too; price changes can improve intensity with no real reduction.
Summary and key terms
- Non-financial measures are often leading, controllable and timely, but lack a common unit and can be manipulated.
- Manufacturing cycle efficiency is processing time divided by throughput time; for Components it is 12.5 percent.
- Operational measures should be used in balanced sets with fixed definitions.
- The GHG Protocol divides emissions into scope 1 (direct), scope 2 (purchased energy) and scope 3 (value chain).
- For Cormorant, scope 3 use-phase emissions are more than a hundred times scopes 1 and 2.
- Internal carbon prices take the form of shadow prices for decisions or internal fees charged to divisions.
- In the United States, federal climate disclosure rules are not in force; California's SB 253 applies to large companies from 2026.
- Throughput time
- The total time from start of production to completion, including processing, inspection, move and queue time.
- Manufacturing cycle efficiency
- Value-added processing time divided by throughput time.
- First-pass yield
- The share of units that pass inspection the first time.
- Scope 1 emissions
- Direct emissions from sources a company owns or controls.
- Scope 2 emissions
- Indirect emissions from purchased electricity, steam, heating and cooling.
- Scope 3 emissions
- All other indirect emissions in a company's value chain.
- Emissions intensity
- Emissions per unit of activity, such as metric tons per million dollars of sales.
- Internal carbon price
- A monetary value per metric ton of emissions used in decisions or charged to divisions.
- Shadow price
- A carbon price applied in decisions but not charged to divisions.
- Financial materiality
- The relevance of a sustainability matter to a company's value.
Practice problems
Work each problem on paper first, then reveal the answer to check.
Rerun the cycle time program with inspection time cut to zero. New MCE?
Show answer
2.0 / 15.5 = 12.9%.
What queue time would give an MCE of 25 percent, holding other times constant?
Show answer
4.0 hours (throughput 8 hours).
Rerun the emissions program with a carbon price of $150. Services' margin after the charge?
Show answer
$905,000.
What is Components' emissions intensity if its sales rise to $26,000,000 with unchanged emissions?
Show answer
About 157.7 metric tons per million dollars.
Rerun the emissions program with heat pump share of 70 percent. Use-phase emissions?
Show answer
912,000 metric tons.
In the van example, what shadow price would make the two options equal?
Show answer
$25 per metric ton.
Why should Appliances not be charged an internal fee for scope 3 use-phase emissions?
Show answer
Its managers cannot control customers' use or the grid; use the measure for strategy and product design instead.
Give an example of reducing reported scope 1 emissions without a real reduction.
Show answer
Outsourcing an energy-intensive process, moving the emissions to scope 3.
Why are behavioral customer measures generally more reliable than satisfaction surveys?
Show answer
They record what customers do rather than what they say.
Distinguish financial materiality from impact materiality.
Show answer
Financial: effects on the company's value. Impact: the company's effects on people and the environment.
Lesson quiz · 5 questions
Score 60% or more to complete this lesson.
Create a free account to save your progress, take quizzes and earn a certificate.