
PWR-110 · Lesson 10 of 12 · 25 min
Drawings, plant diagrams and log sheets
▶ Video coming soon A video version of this lesson is on the way.
On Wednesday, October 28, 2026, Fenella asked the day shift to find out why the make-up water meter had been reading higher every week since the start of the month. Lorne handed Tamar the plant's piping and instrument diagram for the condensate return system and the last four weeks of log sheets. By the end of the shift she had worked out, from the logged meter totals, that the plant was returning less of its condensate than in September, and on the drawing she had found the three customer buildings whose return lines joined the main just upstream of a meter that was also reading low. The next morning Pilar found a trap on the Ardoch Tower's return blowing steam to a drain. "The drawing told you where to look," Lorne said, "and the log told you something had changed. That's what they're for."
This lesson explains the drawings an engineer uses, how to read the symbols on a piping and instrument diagram, and how logs and log sheets record the life of a plant. The symbols shown are typical of those based on the ISA 5.1 standard, but every plant's drawings have a legend sheet that defines its own symbols, and that legend is the authority.
The drawings in a plant
A plant has several kinds of drawings, each showing something different:
- A process flow diagram (PFD) shows the main equipment and the main flows between them, often with design flows, temperatures and pressures, but not every valve or instrument. Lesson 1's plant figure is a simple PFD.
- A piping and instrument diagram (P&ID) shows every line, valve, instrument, control loop and piece of equipment in a system, with line numbers, sizes and tags. It is not drawn to scale or in true positions; it shows how things are connected. P&IDs are the main drawings for isolation lists, troubleshooting and training.
- Isometric drawings show individual pipe runs in three dimensions with dimensions, fittings and supports, and general arrangement drawings show where equipment actually sits in the building.
- Electrical single-line diagrams show how power flows from the utility through transformers, switchgear and motor control centres to each motor, and schematics and wiring diagrams show control circuits in detail.
Every drawing has a title block with the drawing number, title, scale, the people who drew and checked it, and a revision block listing each change and its date. Using the latest revision matters: an isolation list written from an old P&ID can miss a valve that was added later. Cantwell keeps controlled copies in the control room and marks up any field change in red until the drawing is formally revised.
Reading a P&ID
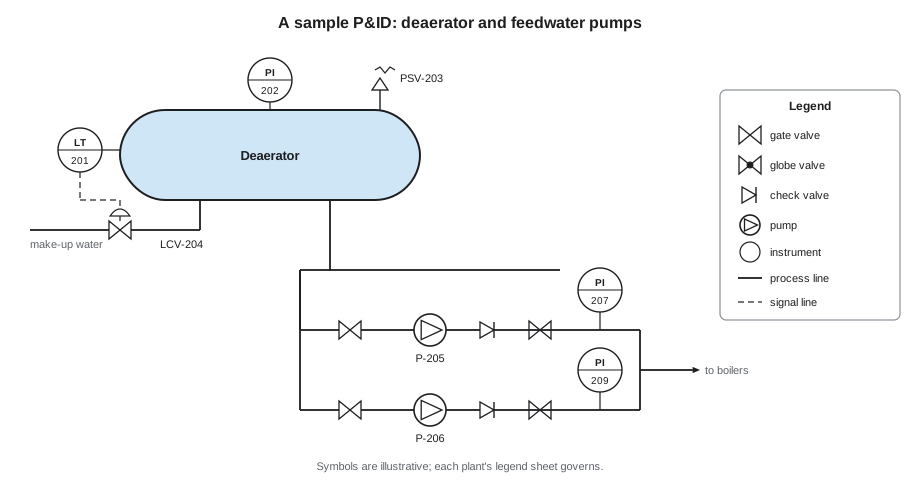
P&IDs use a symbol language. Lines show what flows: a solid line for process piping, dashed lines for electrical signals, and other line styles for pneumatic signals and data links. Arrows show flow direction. Equipment such as pumps, tanks, heat exchangers and boilers has its own outline. Valves have symbols that show their type, and a filled or open symbol may show whether a valve is normally closed or normally open.
Instruments are shown as bubbles, circles with a tag inside. The tag's letters say what the instrument measures and does: the first letter is the measured variable and the following letters are its function. A line through the bubble, or a bubble inside a square, shows where the instrument's reading is available: in the field, on a control room panel, or in the control system. The number is the loop number, shared by every instrument in the same control loop.
| Letters | Meaning | Example |
|---|---|---|
| PI | Pressure indicator (a gauge) | PI-104 on the feedwater header |
| TI | Temperature indicator | TI-220 on the deaerator outlet |
| LT | Level transmitter | LT-301 on boiler 1 drum |
| FT | Flow transmitter | FT-410 on the steam header |
| PIC | Pressure indicating controller | PIC-101 controlling header pressure |
| LSLL | Level switch, low-low (often a trip) | LSLL-301 low water cutoff |
| PSV | Pressure safety valve | PSV-115 on the deaerator |
| TCV, LCV, FCV | Temperature, level, flow control valve | LCV-301 boiler feedwater control valve |
Worked problem
Tracing an isolation on a P&ID
To work on feedwater pump 2, which valves on the sample P&ID must be closed and locked, and which drain or vent must be opened?
Show solution
- Suction side: the gate valve between the deaerator outlet header and pump 2.
- Discharge side: the gate valve after the check valve on pump 2's discharge; the check valve alone is not isolation.
- Other connections drawn on the pump: the recirculation line valve and the seal water valve.
- Release: the casing drain and casing vent, opened once the valves are locked.
Answer: Four valves closed and locked and two opened, plus the motor breaker. This is the list Tamar wrote in lesson 5, and the balance line Lorne added was on a second sheet; continuation arrows at the edge of a P&ID show where a line carries on to another drawing, and every one must be followed.
Why logs matter
The log is the plant's legal and technical record. It shows who was on duty, what the plant was doing, what was tested, what went wrong and what was done about it. After an incident, investigators read the log first; a clear, honest log protects the engineers who kept it. Day to day, the log is how one shift tells the next what has happened, and how the chief engineer keeps track of the plant.
In Ontario, O. Reg. 219/01 sets requirements for the log. In summary, it must be kept in the plant, as a bound book with numbered pages or as an electronic log with a dated paper copy each shift; entries are in ink and errors are crossed out and initialled, never erased; only the chief or a shift engineer or operator makes or signs entries; the chief reads and signs it at least once each business day; and logs are kept for at least three years after the last entry and shown to an inspector on request. The regulation lists the kinds of entries required, including shift times and staff, instructions received, changes from normal procedure, abnormal conditions, equipment starts and stops, repairs and malfunctions, and routine work such as blowdowns, control tests and safety valve tests.
Log sheets
Alongside the written log, most plants use log sheets: printed or electronic forms with a column for each reading taken on rounds, such as boiler steam pressure, drum level, feedwater pressure and temperature, flue gas temperature and oxygen, fuel flow, steam flow, deaerator pressure and level, softener status, chemical tank levels and water test results. The sheet shows the normal range for each reading so that an engineer can see at a glance whether a value is out of line, and readings outside the range are circled and explained in the log.
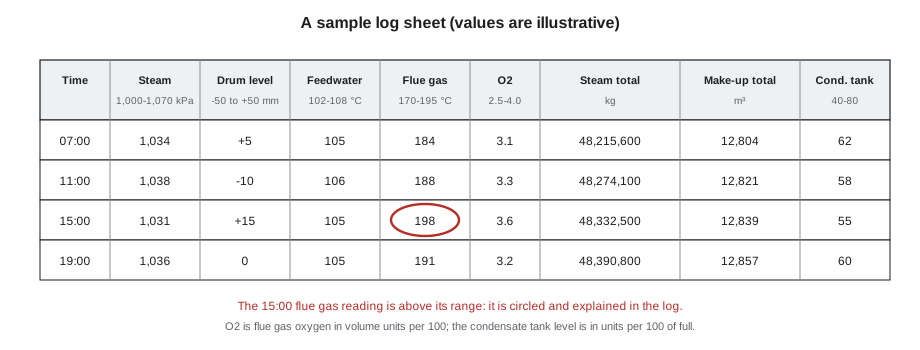
Good readings are taken the same way each time, at the same instrument, and written down as read, not rounded to what was expected. A reading that has not changed for days on an instrument that should move can mean a stuck gauge or a failed transmitter. The trend matters as much as the value: a flue gas temperature that rises a few degrees each week can mean soot or scale building up on the heating surfaces, long before it trips an alarm.
Worked problem
Condensate return from the log
Over one week the feedwater totalizer showed 2,300 m³ of water fed to the boilers, and the make-up water meter showed 575 m³ added from the softeners. What fraction of the feedwater was returned condensate?
Show solution
- Condensate returned:
- \[2{,}300 - 575 = 1{,}725 \text{ m}^3\]
- Fraction:
- \[1{,}725 \div 2{,}300 = 0.75\]
Answer: About 75 in 100 of the feedwater was returned condensate. In September the same calculation had given about 82 in 100. The drop meant hot, treated water was being lost somewhere, which cost fuel, water and chemicals, and it was the change Tamar spotted before the faulty trap was found.
Writing a good log entry
A good entry is specific, timed and factual. It says what was seen, what was done, and what is still outstanding. "Boiler 2 tripped" is a start; "14:22 Boiler 2 flame failure lockout, scanner signal low. Checked fuel train, purged, one restart 14:35, held. Instrument tech notified, work order 4471. Monitoring." is an entry the next shift can act on. Opinions and blame do not belong in the log, but uncertainty does: "cause not yet known" is honest and useful.
| Do | Do not |
|---|---|
| Write the time for every event | Leave times out or fill them in later from memory |
| Record readings as read | Round readings to what was expected |
| Cross out an error with one line and initial it | Erase, white out or tear out a page |
| Say what is still outstanding | Assume the next shift will find out |
| Write facts and actions | Write blame or opinions about people |
| Sign at the end of the shift | Let someone else sign for you |
Valve symbols and what they tell you
On a P&ID, the shape of a valve symbol tells the engineer how the valve works and what it is for. A gate valve is drawn as two triangles point to point and is used for isolation: fully open or fully closed, never throttling. A globe valve adds a dot or filled circle between the triangles and is used to throttle flow. A check valve has an arrow or a line showing the one direction it lets flow pass. A ball valve shows a circle between the triangles and turns a quarter turn from open to closed. A control valve has an actuator drawn on top, often a dome for a diaphragm actuator, with a signal line running to it. A safety valve or relief valve has a spring symbol and discharges to a vent or drain. Knowing these at a glance lets an engineer read a P&ID quickly and spot, for example, that a line has only a globe valve where isolation needs a gate valve.
P&IDs also mark normal positions. Many plants draw normally closed valves filled in black or label them NC, and use LO and LC for valves that are locked open or locked closed as part of the plant's design, such as the valve under a safety valve, which must always be locked open so the safety valve can do its job. A locked valve changed without authority is a serious event, and the plant keeps a register of every locked valve, checked on a schedule.
Electronic logs and trends
Many plants now keep their logs and log sheets electronically, on tablets or in the control system, with the control system also recording thousands of readings every minute as trends. Electronic records make it easy to search for past events and to plot readings over weeks or months. They have their own risks: an engineer can copy yesterday's entry by mistake, a reading can be entered against the wrong boiler, and records can be lost if the system fails. That is why plants that use electronic logs print and sign a copy each shift, back up the records, and still expect the engineer to look at the instrument, not only the screen.
Worked problem
Spotting a trend
Boiler 1's flue gas temperature at full load was logged as 186 °C on October 5, 190 °C on October 12, 193 °C on October 19 and 197 °C on October 26. What is the average rise per week, and how many weeks until it reaches the supplier's cleaning trigger of 205 °C if the trend continues?
Show solution
- Total rise over 3 weeks:
- \[197 - 186 = 11 \ ^\circ\text{C}\]
- Average per week:
- \[11 \div 3 \approx 3.7 \ ^\circ\text{C}\]
- Weeks to the trigger:
- \[(205 - 197) \div 3.7 \approx 2.2\]
Answer: About two weeks. Every reading was within the normal range, but the steady rise showed deposits building on the heating surfaces. Grazyna scheduled a fireside inspection and cleaning for the first week of November, and the temperature fell back to its September value afterwards.
Common mistakes
MistakeWriting an isolation list from an out-of-date P&ID.
InsteadUse the latest controlled revision and check field mark-ups; follow every continuation arrow.
MistakeTreating a check valve as isolation.
InsteadCheck valves only stop reverse flow; isolate with closed and locked manual valves.
MistakeCorrecting a log entry with correction fluid.
InsteadCross it out with one line, initial it and write the correction.
MistakeWriting readings to match the normal range.
InsteadWrite exactly what the instrument shows and explain anything out of range.
MistakeIgnoring a slow trend because each reading is within range.
InsteadCompare readings over days and weeks; trends warn early.
Summary and key terms
- Plants use PFDs, P&IDs, isometrics, general arrangements and electrical single-lines and schematics.
- P&IDs show how lines, valves, instruments and equipment are connected, not their true positions.
- Instrument tags give the measured variable and function, such as PI, LT, FT, PIC and PSV.
- Always use the latest revision and follow continuation arrows to other sheets.
- O. Reg. 219/01 sets the log's form, content, signing and three-year retention.
- Log sheets record rounds readings against normal ranges; trends matter as much as values.
- Good entries are timed, specific and factual, and errors are crossed out and initialled.
- PFD
- Process flow diagram, showing main equipment and flows.
- P&ID
- Piping and instrument diagram, showing every line, valve and instrument and how they connect.
- Instrument tag
- Letters and a loop number identifying an instrument's variable and function.
- Title block
- The part of a drawing with its number, title, scale and approvals.
- Revision block
- The list of changes made to a drawing and their dates.
- Log
- The plant's written record of operation, events and tests.
- Log sheet
- A form for recording rounds readings against normal ranges.
Practice problems
Work each problem on paper first, then reveal the answer to check.
What does a P&ID show that a PFD usually does not?
Show answer
Every valve, instrument and line with its tag, number and size.
What do the letters LT mean on an instrument bubble?
Show answer
Level transmitter.
Why is a check valve not isolation?
Show answer
It only stops reverse flow and can leak or be forced open.
Feedwater was 2,300 m³ and make-up 575 m³. What fraction was condensate?
Show answer
0.75, or 75 in 100.
How is a wrong log entry corrected?
Show answer
Crossed out with a single line, initialled, and the correction written.
Lesson quiz · 5 questions
Score 60% or more to complete this lesson.
Create a free account to save your progress, take quizzes and earn a certificate.