
NUC-350 · Lesson 7 of 12 · 20 min
Core loading patterns
Teodora shows Hana a map of the Darlington core with each of the 480 channels coloured by the burnup of its fuel. The colours are not random. The channels near the centre are a little darker, meaning their fuel stays in longer and reaches a higher exit burnup; the channels near the edge are lighter. "This is our loading pattern," Teodora says. "In a CANDU it is not a one-time map. It is a rule for how often each region gets fresh fuel, and the result is a flatter power shape than a uniform core would give."
What a loading pattern controls
A loading pattern is the arrangement of fuel of different reactivities in the core. Its goals pull in different directions. Placing the most reactive fuel where neutrons are least likely to leak, near the centre, gives the best neutron economy and the longest cycle, but tends to concentrate power and raise the peaking factor. Placing fresh fuel near the edge flattens the power but wastes neutrons through leakage and exposes the reactor vessel to more fast flux. A good pattern meets every safety limit on power peaking and reactivity coefficients with margin, achieves the required cycle length and burnup, and does so with the least fuel cost.
| Objective or constraint | Typical measure | Why it matters |
|---|---|---|
| Cycle length or energy | effective full-power days | the utility needs the unit to run until the planned outage |
| Power peaking | F_ΔH, F_q, or maximum channel and bundle power | limits on fuel temperature, heat flux and margin to dryout or departure from nucleate boiling |
| Shutdown margin | pcm or mk with the most reactive rod stuck out | the reactor must be shut down safely in all states |
| Moderator and power coefficients | pcm per kelvin or per percent power | must meet safety analysis limits at all times in the cycle |
| Vessel fluence | fast fluence at the vessel wall | controls embrittlement and plant life |
| Fuel cost | enrichment, number of fresh assemblies, discharge burnup | the economic objective |
Three classic strategies
Batch-loaded cores have used three broad strategies over the history of the industry. In an out-in pattern, fresh fuel is loaded at the periphery and moved inward in later cycles. This flattens the radial power shape, because the highly reactive fresh fuel offsets the leakage at the edge, but it sends many neutrons into the reflector and vessel. In a scatter or checkerboard pattern, fresh and burned assemblies are mixed throughout the core, so that each fresh assembly is surrounded by burned ones that absorb some of its excess neutrons. In a low-leakage pattern, fresh fuel is placed mostly in the interior, and twice-burned fuel, with the lowest reactivity, is placed at the periphery to act partly as a reflector.
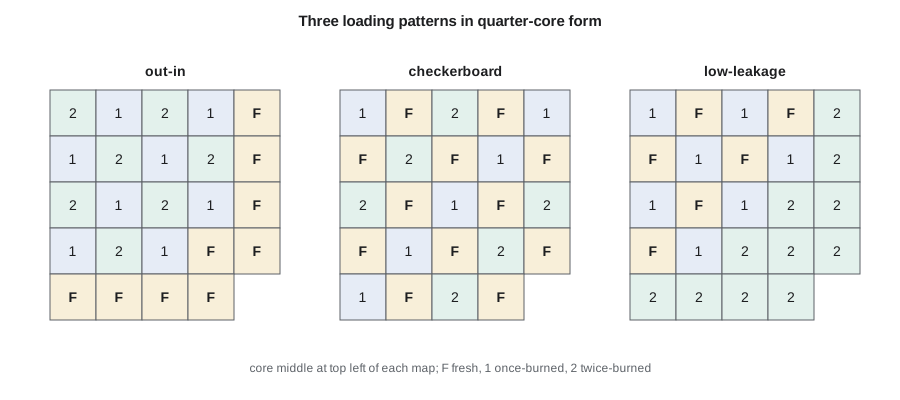
Since the 1980s, low-leakage patterns have become standard for light-water reactors. They extend the cycle by improving neutron economy and reduce the fast flux on the reactor vessel, which slows embrittlement. Their disadvantage is higher power in the fresh assemblies in the interior, which must be controlled with burnable absorbers. The development of integral burnable absorbers and gadolinia rods, described in lesson 6, is what made low-leakage patterns practical.
A one-dimensional loading study
The program below compares three patterns in a one-dimensional, one-group model of a core of eight zones from centre to edge, with a reflector outside. Each zone holds fresh, once-burned or twice-burned fuel with an illustrative k_inf. The program solves for k and the relative power in each zone.
# Core loading patterns in a one-dimensional, one-group model of a core with a
# reflector. Each of 8 fuel zones (centre to edge) holds fresh (F), once-burned (1)
# or twice-burned (2) fuel. Batch k_inf values are illustrative. We compare the
# radial power peaking and leakage for three common strategies.
def run(pattern, kinf={'F': 1.20, '1': 1.10, '2': 1.02}, width=20.0, refl=3, n_per=6):
    zones = list(pattern) + ['R'] * refl
    D, sa, nsf = [], [], []
    for z in zones:
        for _ in range(n_per):
            if z == 'R': D.append(1.2); sa.append(0.004); nsf.append(0.0)
            else: D.append(1.5); sa.append(0.008); nsf.append(0.008 * kinf[z])
    n = len(D); h = width / n_per
    phi, k = [1.0] * n, 1.0
    for _ in range(400):
        src = [nsf[i] * phi[i] / k for i in range(n)]
        # tridiagonal: reflective (symmetry) at centre, zero flux at outer edge
        a = [0.0] * n; b = [0.0] * n; c = [0.0] * n
        for i in range(n):
            Dw = 2 * D[i] * D[i - 1] / (D[i] + D[i - 1]) if i else 0.0
            De = 2 * D[i] * D[i + 1] / (D[i] + D[i + 1]) if i < n - 1 else 2 * D[i]
            a[i] = -Dw / h**2; c[i] = -De / h**2 if i < n - 1 else 0.0
            b[i] = (Dw + De) / h**2 + sa[i]
        cp, dp = [0.0] * n, [0.0] * n
        for i in range(n):
            m = b[i] - (a[i] * cp[i - 1] if i else 0.0)
            cp[i] = c[i] / m; dp[i] = (src[i] - (a[i] * dp[i - 1] if i else 0.0)) / m
        new = [0.0] * n
        for i in reversed(range(n)):
            new[i] = dp[i] - (cp[i] * new[i + 1] if i < n - 1 else 0.0)
        k = k * sum(nsf[i] * new[i] for i in range(n)) / sum(nsf[i] * phi[i] for i in range(n))
        phi = new
    nf = len(pattern) * n_per
    power = [nsf[i] * phi[i] for i in range(nf)]
    zp = [sum(power[j * n_per:(j + 1) * n_per]) for j in range(len(pattern))]
    avg = sum(zp) / len(zp)
    return k, [p / avg for p in zp]
for name, pat in (("out-in (fresh at the edge)", "22211FFF"),
                  ("checkerboard scatter",       "F2F1F2F1"),
                  ("low-leakage (fresh inside)", "2F1F1F22")):
    k, rel = run(pat)
print(f"{name:28s} k = {k:.4f} peak zone power = {max(rel):.2f} zones: " + " ".join(f"{x:.2f}" for x in rel))out-in (fresh at the edge) k = 1.0876 peak zone power = 1.53 zones: 0.51 0.57 0.72 1.01 1.24 1.53 1.42 1.00 checkerboard scatter k = 1.1191 peak zone power = 1.59 zones: 1.59 1.22 1.38 1.13 1.05 0.68 0.61 0.34 low-leakage (fresh inside) k = 1.1101 peak zone power = 1.40 zones: 1.07 1.40 1.30 1.38 1.09 0.94 0.52 0.29
The out-in pattern has the lowest k, because the fresh fuel sits where leakage is highest, but its power peaks near the edge. The checkerboard pattern, which here puts fresh fuel at the centre, has the highest k but also a high central peak. The low-leakage pattern has an intermediate k and the lowest peak. In this crude model, the low-leakage pattern wins on peaking; in real cores with burnable absorbers, it wins on both peaking and cycle length, which is why it is the industry standard.
Worked problem
Relating k to cycle length
In a design study, two candidate patterns differ by 450 pcm in beginning-of-cycle reactivity at the same boron. The core loses about 10 pcm per effective full-power day late in the cycle. Estimate the difference in cycle length.
Show solution
- Late in the cycle, extra reactivity translates into extra days at the rate of loss.
- 450 pcm/(10 pcm per day) = 45 effective full-power days.
Answer: A pattern change worth 450 pcm buys about six weeks of operation, which is why loading pattern optimization has such high economic value.
Loading patterns in a CANDU core
A CANDU core is never reloaded all at once, so its loading pattern takes a different form. The core is divided into regions, typically an inner region and an outer region, with different target exit burnups. Fuel in the inner region is left in the channel longer, reaching higher burnup and lower reactivity, while the outer region is refuelled more often. This differential fuelling flattens the radial power distribution in the same way as a low-leakage pattern does in a light-water reactor, but it is achieved by the timing of refuelling rather than the placement of fresh assemblies. Adjuster rods, placed near the centre of the core, add further flattening. The result is a radial power distribution flat enough that a large fraction of channels run near the maximum channel power.
The direction of refuelling also matters. In a CANDU reactor, adjacent channels are refuelled in opposite directions, so that fresh fuel enters at one face of the core in one channel and at the other face in its neighbours. This bidirectional fuelling makes the axial power distribution symmetric when averaged over the core, even though each channel individually has fresh fuel at one end and highly burned fuel at the other.
Searching for the best pattern
For a 193-assembly core with eighth-core symmetry, the number of possible arrangements of fuel is astronomically large, far too many to evaluate one by one. Designers reduce the search with experience, rules and computer optimization. Rules include keeping fresh assemblies from touching each other face to face, placing twice-burned fuel at the periphery and keeping the highest-burnup assemblies away from the core centre. Optimization methods include simulated annealing, genetic algorithms and more recent machine learning methods, all of which use a fast core simulator to evaluate thousands of candidates against the objectives and constraints. The final pattern is always checked with the full licensing methods.
In a CANDU core, the equivalent search is continuous and much smaller in scope: each week, the fuelling engineer chooses which channels to refuel next. Lesson 12 develops a simple version of that choice. The equilibrium pattern of regions and target burnups is set when the station is designed and refined with operating experience.
Shuffling, symmetry and practical limits
Several practical points shape real patterns. Most patterns are designed with quarter-core or eighth-core rotational or mirror symmetry, so that the core simulator can model a fraction of the core and the power distribution is easier to monitor with in-core detectors. Assemblies may be rotated when moved, to even out burnup gradients across them. Some locations, such as those with in-core instruments or neutron sources, have restrictions. Assemblies with known defects or those being kept for inspection programs may be placed in low-power positions or removed. The schedule of the outage itself, which may move dozens of assemblies, must also be planned so that the core remains subcritical and well monitored at every step of fuel movement.
Reading a loading pattern map
A loading pattern is usually shown as a quarter-core or full-core map, with each assembly or channel marked by its batch, burnup, enrichment or burnable absorber loading. Experienced designers read such maps for warning signs: two fresh assemblies sharing a face, a high-burnup assembly at the core centre where it would have little reactivity left, a fresh assembly at a corner of the core where its neutrons would leak into the reflector, or an asymmetric arrangement that could tilt the power. The predicted power map is then laid over the loading map to show where peaks occur. Peaks often appear in once-burned assemblies next to fresh ones, because the burned assembly has lost its burnable absorber while still receiving many neutrons from its fresh neighbour.
| Warning sign on a pattern map | Likely consequence | Usual fix |
|---|---|---|
| Two fresh assemblies face to face | high local peaking | separate them with burned fuel |
| Fresh assembly at a core corner | leakage and wasted reactivity | move it inward; place burned fuel at the corner |
| High-burnup assembly at the centre | low central power, peaks elsewhere | move it toward the periphery |
| Once-burned assembly between two fresh ones | peak late in the cycle after absorbers burn out | adjust neighbours or burnable absorbers |
In a CANDU core, the equivalent map shows each channel's exit burnup, time since last refuelling and current power. The fuelling engineer reads it for clusters of recently refuelled channels, which could raise local power, and for regions where many channels are approaching high burnup at the same time, which would require concentrated refuelling in the coming days.
Loading patterns also have to respect practical constraints. Some assemblies have known minor defects or inspection findings that limit where they may go; some locations hold instrumentation that requires particular assembly types; and the refuelling sequence must allow the crew to move fuel safely and efficiently. A pattern that is optimal on paper but needs many extra moves may cost outage time, so the final choice balances physics with practicality.
Common mistakes
MistakePutting all the fresh fuel at the centre always gives the best pattern.
InsteadIt gives good neutron economy but can raise peaking beyond limits; burnable absorbers and careful placement are needed.
MistakeLoading patterns only matter for cycle length.
InsteadThey also control peaking, coefficients, shutdown margin and vessel fluence.
MistakeA CANDU core has no loading pattern because it is refuelled continuously.
InsteadDifferential fuelling of regions and bidirectional fuelling form its loading pattern.
Summary and key terms
- A loading pattern arranges fuel of different reactivities to meet cycle, safety and cost goals.
- Out-in, checkerboard and low-leakage patterns trade neutron economy against peaking.
- Low-leakage patterns with burnable absorbers are the light-water reactor standard today.
- CANDU cores flatten power by differential fuelling of regions and by bidirectional refuelling.
- Loading pattern searches use rules and optimization with fast core simulators, followed by licensing checks.
- Loading pattern
- The arrangement of fresh and burned fuel in the core for a cycle.
- Low-leakage pattern
- A pattern that places fresh fuel in the interior and burned fuel at the periphery.
- Peaking factor
- The ratio of the maximum local power to the core average.
- Differential fuelling
- Refuelling CANDU core regions at different rates to flatten the power distribution.
- Bidirectional fuelling
- Refuelling adjacent CANDU channels from opposite faces of the core.
- Shuffle
- The movement of burned assemblies to new positions at a refuelling outage.
Practice problems
Work each problem on paper first, then reveal the answer to check.
Why do low-leakage patterns reduce vessel embrittlement?
Show answer
They place low-reactivity burned fuel at the periphery, lowering the fast flux reaching the vessel.
What is the main drawback of a low-leakage pattern?
Show answer
Fresh fuel in the interior runs at high power, raising peaking unless burnable absorbers are used.
In the example, how many days does 450 pcm buy?
Show answer
About 45 effective full-power days.
How does a CANDU core flatten its radial power?
Show answer
By refuelling the outer region more often than the inner region, and with adjuster rods.
Why are adjacent CANDU channels refuelled in opposite directions?
Show answer
To make the core-average axial power distribution symmetric.
Lesson quiz · 5 questions
Score 60% or more to complete this lesson.
Create a free account to save your progress, take quizzes and earn a certificate.