
MSAZ-319 · Lesson 6 of 12 · 20 min
Review: implementing and managing semantic models
▶ Video coming soon A video version of this lesson is on the way.
Semantic models were Keiko's strongest area on the diagnostic, 15 of 20, and the area she enjoys most. Marisol reviewed it on Thursday, November 26, in a single evening, but she warned that strong areas carry a particular risk: a candidate who knows one way to do something well tends to choose it even when the item describes a case where another way is better. So the review is less about learning new features than about knowing when each one fits. On the current outline the area is about a quarter of the exam, split into designing and building semantic models and optimizing enterprise-scale semantic models.
Keiko's fall work gave her two models to rehearse with. Store Sales is a Direct Lake model over the wh_sales star, with row-level security for store managers and a calculation group for time intelligence. Finance Margin is a certified import model with incremental refresh on the sales fact table and an aggregation table for the monthly margin report. Between them they cover most of the skills on the outline.
Storage modes
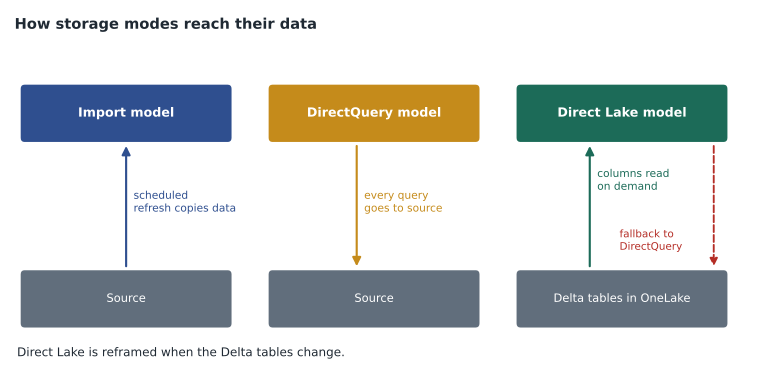
The first decision for any model is how it reaches its data. Import loads a compressed copy into the model and gives the fastest queries, but the data is only as fresh as the last refresh and the model must fit in the capacity's memory. DirectQuery sends every visual's query to the source, so data is always current, but queries are slower and the source carries the load. Direct Lake reads Delta tables in OneLake directly into memory when queried, without a scheduled import, which gives import-like speed with data that is current as of the last reframing. A composite model mixes modes, for example a large fact table in DirectQuery with small dimensions in import, or a local model that extends a shared model with its own tables.
| Mode | Freshness | Query speed | Main limit |
|---|---|---|---|
| Import | As of last refresh | Fastest | Memory and refresh time |
| DirectQuery | Current | Depends on the source | Source load and some DAX limits |
| Direct Lake | As of last reframe of Delta tables | Close to import | Guardrails per capacity size; fallback to DirectQuery in some cases |
| Dual | Either, per query | Import when possible | Used for dimensions in composite models |
Direct Lake deserves attention because it is new and appears often. A Direct Lake model reads only the columns a query needs, loading them into memory on demand, and it can be reframed, which means pointing it at the latest version of the Delta tables, automatically when data changes or by a refresh. There are guardrails by capacity size, such as the number of rows per table and the number of files; when a table exceeds them, or when the model reads through a SQL analytics endpoint with security that requires it, queries can fall back to DirectQuery and become slower. Direct Lake on OneLake reads the Delta tables directly; Direct Lake on SQL endpoints goes through the SQL analytics endpoint and can fall back. Exam items often ask what causes fallback or how to prevent it.
Relationships and model design
A good model is a star: fact tables related to dimension tables by one-to-many relationships with single-direction filtering from the dimension to the fact. Items test the exceptions. A many-to-many relationship between two tables is best resolved with a bridge table, as for households; a direct many-to-many relationship is allowed but can produce unexpected totals. Bidirectional filtering should be limited to the bridge, because it slows queries and can create ambiguous paths. A role-playing dimension, such as date used for order date and ship date, needs one active relationship and the others inactive, used in measures with USERELATIONSHIP. A date table must be marked as a date table for time intelligence functions to work reliably.
DAX for the exam
The outline names variables, iterators, table filtering, windowing functions and information functions. Variables, declared with VAR and returned with RETURN, make measures readable and avoid computing the same expression twice. Iterators such as SUMX and AVERAGEX evaluate an expression row by row over a table, for example the margin of each sale line, then aggregate. CALCULATE changes the filter context, and its filter arguments can be simple conditions, FILTER over a table, or modifiers such as ALL, REMOVEFILTERS and KEEPFILTERS. Windowing functions such as WINDOW, OFFSET and INDEX return rows relative to the current one, which makes running totals and comparisons with the previous period simpler than older patterns. Information functions such as ISINSCOPE and HASONEVALUE let a measure behave differently at a total row.
Calculation groups, created in Tabular Editor or in Power BI Desktop's model view, apply the same logic to many measures. Keiko's Time Intelligence group has items for Current, Prior Year and Year to Date, each using SELECTEDMEASURE() to wrap whatever measure is on the visual, so she wrote three items instead of thirty measures. Field parameters let report users switch the measure or dimension on a visual from a slicer. Dynamic format strings let a measure choose its own format, such as showing thousands with a K suffix, and they can be set on a measure or a calculation item.
Security in the model
Lesson 4 covered model security as part of governance; here the focus is on building it. A role has a DAX filter on one or more tables, and filters flow through relationships, so filtering the store dimension filters sales. Dynamic security uses USERPRINCIPALNAME() against a security table, which keeps one role for every store manager instead of a role per store. Object-level security hides a table or column from a role and is set in Tabular Editor or with TMDL. Validation is part of the skill: 'view as' in Power BI Desktop or the service shows the model as a role or a user would see it, and testing must not use an account that has edit rights.
Optimizing enterprise-scale models
The optimization skills are about large models. Large semantic model storage format lets a model grow beyond the default size limit and is required for some features; it is set in the model's settings and is on by default for new models in many tenants. Incremental refresh splits a table into date partitions, refreshes only the recent ones and keeps the older ones, which turns a long full refresh into a short one; it needs RangeStart and RangeEnd parameters that filter the source query and a policy saying how much history to keep and how much to refresh. Aggregations store a summarized table, such as sales by month and store, that answers summary queries from memory while detail queries go to the detail table. DAX Studio shows query timings, server timings and the storage engine queries behind a measure; Tabular Editor 2 edits the model's metadata, runs Best Practice Analyzer rules and deploys through the XMLA endpoint.
Keiko's Finance Margin model is the example to remember. Its sales table holds seven years of history; incremental refresh keeps all seven and refreshes only the last 10 days each night, and the aggregation table answers the monthly margin report without touching the detail rows. The night refresh fell from 38 minutes to under 6.
A measure to read slowly
Many semantic model items show a measure and ask what it returns or which line to change. The listing below is close to one Keiko wrote for Finance Margin, and Marisol used it to rehearse reading DAX line by line before looking at any options.
Margin Change vs Prior Year =
VAR CurrentMargin =
    DIVIDE ( [Gross Margin], [Net Sales] )
VAR PriorMargin =
    CALCULATE (
        DIVIDE ( [Gross Margin], [Net Sales] ),
        SAMEPERIODLASTYEAR ( 'Date'[Date] )
    )
RETURN
    IF ( OR ( ISINSCOPE ( 'Store'[Store Name] ), ISINSCOPE ( 'Store'[Region] ) ),
         CurrentMargin - PriorMargin,
         BLANK () )
Read from the top. The first variable holds the margin in the current filter context; DIVIDE returns blank instead of an error when net sales are zero. The second variable changes the filter context with CALCULATE so that the date filter moves to the same period a year earlier, which needs a marked date table. The RETURN line uses ISINSCOPE so that the difference shows only when the visual is grouped by store or region, and the grand total row is blank. An exam item might ask what appears on the total row, which is blank, or what happens if the date table is not marked, which is that SAMEPERIODLASTYEAR may return wrong or empty results. Reading the variables first, then the RETURN line, is faster than reading the whole measure in one pass.
Choosing among the optimization tools
The optimization skills often appear as a short problem and four tools. A report page is slow, and the question is which tool shows why: Performance Analyzer in Power BI Desktop records how long each visual takes and copies the DAX query it sends; DAX Studio runs that query and splits its time between the formula engine and the storage engine, which shows whether the problem is the measure logic or the data volume; Tabular Editor 2 with Best Practice Analyzer flags model design problems such as unused columns, bidirectional relationships and columns with high cardinality; and VertiPaq Analyzer, inside DAX Studio, shows which tables and columns use the most memory. Keiko's habit is to start with Performance Analyzer to find the slow visual, take its query to DAX Studio, and look at the model with Best Practice Analyzer only if the query points to a design problem.
| Symptom | Tool to use first | What it shows |
|---|---|---|
| One visual on a page is slow | Performance Analyzer | Time per visual and the DAX query it sends |
| A measure is slow at every level | DAX Studio with server timings | Formula engine against storage engine time |
| The model is larger than expected | VertiPaq Analyzer | Memory used by each table and column |
| Many small design problems | Best Practice Analyzer in Tabular Editor 2 | Rules broken across the model |
| A refresh takes too long | Refresh history and incremental refresh | Which tables take the time and whether partitions help |
Two reductions fix many memory problems before any tool is needed: remove columns the reports do not use, and reduce the cardinality of the columns that remain, for example by splitting a date and time column into a date column and a time column rounded to the minute, or by storing a high-precision decimal as a fixed decimal. A column with millions of distinct values compresses poorly, and a timestamp to the second is the most common example in retail data. When Keiko split the till timestamp in Finance Margin into a date column and a time column rounded to the minute, the sales table shrank by about a third, and every visual on the margin page became faster without any change to a measure.
Worked problem
Reading an incremental refresh policy
A policy stores 5 years of data in yearly partitions with monthly partitions for the current year, and refreshes the last 10 days. On November 15, how much of the table is reloaded by a nightly refresh?
Show solution
- The policy refreshes only partitions that contain the last 10 days: November 6 to 15.
- With monthly partitions for the current year, those days lie in the November partition.
- So only the November partition is refreshed; if the period crossed a month, two monthly partitions would be.
- All other partitions keep their data.
Answer: Only the current month's partition, a small part of five years of data.
Common mistakes
MistakeUse Direct Lake and expect it never to send queries to SQL.
InsteadQueries can fall back to DirectQuery when guardrails are exceeded or security requires it.
MistakeTurn on bidirectional filtering on every relationship.
InsteadKeep single direction and use bidirectional filtering only where a bridge needs it.
MistakeWrite a separate measure for every time intelligence variant.
InsteadUse a calculation group with SELECTEDMEASURE().
MistakeIncremental refresh works without filtering the source by RangeStart and RangeEnd.
InsteadThe parameters must filter the source query, ideally in a step that folds.
MistakeValidate row-level security as the model author.
InsteadUse 'view as' with a role, or a test account without edit rights.
MistakeAggregations replace the detail table.
InsteadThey answer summary queries; detail queries still use the detail table.
Summary and key terms
- Import is fastest, DirectQuery is current, Direct Lake reads Delta tables in OneLake with near-import speed and can fall back to DirectQuery.
- Keep a star with one-to-many, single-direction relationships; use bridge tables, inactive relationships and a marked date table.
- Exam DAX covers variables, iterators, CALCULATE and filter modifiers, windowing functions and information functions.
- Calculation groups, field parameters and dynamic format strings reduce the number of measures and visuals.
- Dynamic row-level security uses USERPRINCIPALNAME(); object-level security hides tables and columns.
- Large format, incremental refresh, aggregations, DAX Studio and Tabular Editor 2 are the tools for large models.
- Direct Lake
- A storage mode that reads Delta tables in OneLake into memory on demand, without a scheduled import.
- Fallback
- Direct Lake queries switching to DirectQuery when a guardrail or security setting requires it.
- Reframing
- Pointing a Direct Lake model at the latest version of its Delta tables.
- Calculation group
- A set of calculation items that apply the same logic to any measure.
- Field parameter
- A table that lets report users switch which measure or column a visual shows.
- Incremental refresh
- A policy that partitions a table by date and refreshes only recent partitions.
- Aggregation
- A summarized table that answers summary queries in place of the detail table.
Practice problems
Work each problem on paper first, then reveal the answer to check.
Which storage mode gives current data on every query?
Show answer
DirectQuery.
What function does a calculation item use to refer to the measure on the visual?
Show answer
SELECTEDMEASURE().
Which two parameters does incremental refresh need?
Show answer
RangeStart and RangeEnd.
Which tool shows server timings for a DAX query?
Show answer
DAX Studio.
What is used to activate an inactive relationship in a measure?
Show answer
USERELATIONSHIP.
Lesson quiz · 5 questions
Score 60% or more to complete this lesson.
Create a free account to save your progress, take quizzes and earn a certificate.