
MSAZ-319 · Lesson 3 of 12 · 22 min
Domain weights
▶ Video coming soon A video version of this lesson is on the way.
On Tuesday, November 17, Keiko arrived with a spreadsheet. She had copied the three skill areas from the certification page, the weight ranges from the most often quoted third-party guide, and her diagnostic scores, and she wanted to know how to share out her study time. Marisol liked the spreadsheet but warned her about one cell. 'Those weights are an estimate,' she said. 'The plan has to survive if they turn out to be a few points off. So we will use them to rank the areas and size the budget roughly, not to the last hour.'
This lesson shows how a candidate can turn weights and a diagnostic into a study budget. The method is simple enough to redo in a few minutes whenever a new practice score or a new version of the study guide arrives, which is exactly what Keiko will need to do in June, when the plan starts, and again at each checkpoint.
What a weight means
A weight range such as 45 to 50 means that, out of every 100 points on the exam, between 45 and 50 come from that skill area. It does not say how many items there are, because some items are worth more than one point, and it does not say which skills within the area will be asked. Across all candidates, the exam is assembled to stay within the ranges. For one candidate on one day, the share of items from an area will be somewhere near the middle of its range.
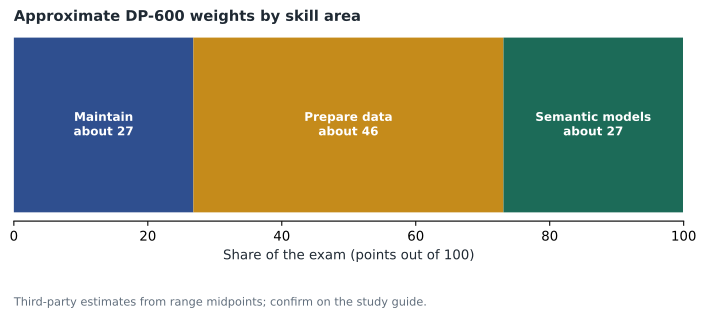
For planning, Keiko uses the middle of each range: about 27.5 for maintaining a data analytics solution, 47.5 for preparing data and 27.5 for semantic models. The three midpoints add up to 102.5 rather than 100, because ranges always overlap a little, so she divides each by 102.5 to get a share of the exam. Preparing data comes out at about 46 in 100, almost half the exam, and the other two areas at about 27 each.
| Skill area | Range (third-party estimate) | Midpoint | Share after scaling to 100 | Diagnostic (of 20) |
|---|---|---|---|---|
| Maintain a data analytics solution | 25 to 30 | 27.5 | about 26.8 | 13 |
| Prepare data | 45 to 50 | 47.5 | about 46.3 | 11 |
| Implement and manage semantic models | 25 to 30 | 27.5 | about 26.8 | 15 |
| Total | 102.5 | 100 | 39 |
From weight and gap to hours
A study budget should give more time to areas that are worth more and to areas where the candidate is weaker. Keiko's gap to the 16 of 20 target is 3 in maintaining the solution, 5 in preparing data and 1 in semantic models. Multiplying the weight by the gap alone would give semantic models almost nothing, which Marisol thought was risky: a strong area still fades if it is never practised, and the diagnostic score of 15 might be a lucky day. So they used weight times the gap plus one. The extra one keeps every area in the plan, and the gap still decides most of the difference.
Keiko expects to study about 110 hours between Tuesday, June 1 and the exam on Thursday, October 14, 2027, roughly five and a half hours a week over nineteen weeks, with some weeks lighter during the summer. The listing below shares those hours by weight times the gap plus one. It runs in the browser.
weights = {"Maintain": 27.5, "Prepare data": 47.5, "Semantic models": 27.5}
scores = {"Maintain": 13, "Prepare data": 11, "Semantic models": 15}
target = 16
total_hours = 110

need = {area: weights[area] * (target - scores[area] + 1) for area in weights}
total_need = sum(need.values())
for area in weights:
    hours = total_hours * need[area] / total_need
    print(f"{area:16} gap {target - scores[area]}  need {need[area]:6.1f}  hours {hours:5.1f}")
print(f"{'Total':16} need {total_need:6.1f} hours {total_hours:5.1f}")Maintain gap 3 need 110.0 hours 26.9 Prepare data gap 5 need 285.0 hours 69.7 Semantic models gap 1 need 55.0 hours 13.4 Total need 450.0 hours 110.0
What this code does
The listing takes the estimated weight of each skill area, Keiko's diagnostic score and her target of 16 out of 20. For each area it multiplies the weight by the size of the gap plus one, so larger and weaker areas count for more but no area drops to zero. It then gives each area its share of the 110 hours in proportion to that number, which puts about 70 hours on preparing data, about 27 on maintaining the solution and about 13 on semantic models.
The result puts about 70 hours on preparing data, about 27 on maintaining the solution and about 13 on semantic models. Keiko was surprised that her favourite area got the least time, but the logic is plain: preparing data is almost half the exam and her weakest area, and semantic models are her strongest and a quarter of it. The 13 hours are not idle; they go mostly into timed practice and into the semantic model topics she missed, such as composite models with aggregations and validating security roles.
Turning hours into a weekly rhythm
Hours on paper do not study themselves. Keiko works full time, and the pilot will keep the data team busy until at least March, so Marisol suggested a weekly rhythm rather than a list of hours. On weekdays, three evenings of about an hour each: one evening of reading and notes, one of a lab from lesson 10, and one of practice items with the error log. On Saturdays, a longer session of about two hours, alternating between a mixed practice set and catching up on whatever the week missed. That is about five hours a week, and nineteen weeks between June 1 and October 14 gives a little under 100 hours, with the rest made up by a few longer weeks in August when the office is quiet.
The rhythm also decides the order of the areas. Because preparing data has the most hours and the most skills not met, it starts first, in June and July, while there is the most time and energy. Maintaining the solution follows in August, closer to the exam, because its topics, such as deployment pipelines and version control, are easier to keep fresh once learned. Semantic models, the strongest area, are reviewed last in short sessions and kept warm through mixed practice sets from the start. Lesson 11 turns this order into dated weeks with checkpoints.
| Day | Session | Length |
|---|---|---|
| Tuesday | Read the course material for one skill and write notes in own words | About 1 hour |
| Wednesday | One lab from lesson 10 on the same skill | About 1 hour |
| Thursday | Ten practice items on the week's skills, then update the error log | About 1 hour |
| Saturday | A mixed practice set or catch-up | About 2 hours |
Measuring progress against the budget
A budget is only useful if it is checked. Each Saturday, Keiko will record hours spent by area next to the hours planned, and the score on that week's practice items. Three numbers matter at each checkpoint: hours spent against plan, the practice score by area, and the number of skills still rated not met. If the hours are on plan but the score in an area is not rising, the problem is the method, not the time, and the next step is a lab or a different source rather than more reading. If the score is rising but hours are behind, she is learning faster than planned and can move time to the weakest area. Marisol's adjustment rule is in lesson 11: any area at or above 16 of 20 at a checkpoint gives up two hours to the weakest area, and any area that has not improved adds a lab and two hours.
There is a cost to this kind of bookkeeping, and Marisol warned Keiko not to let it grow. Five minutes on Saturday is enough: a row in a spreadsheet with the date, hours by area, score by area and skills not met. The point is to notice a problem a month before the exam, not the week before.
Worked problem
A checkpoint adjustment
At the July checkpoint, Keiko has spent 34 of the 40 hours planned for preparing data so far, and her practice score there has risen from 11 to 14 of 20. Semantic models are at 17 of 20. Using the rule that an area at or above 16 gives up two hours to the weakest area, what changes?
Show solution
- Semantic models are at 17, at or above 16, so they give up 2 hours.
- The weakest area is preparing data at 14 of 20.
- Preparing data gains 2 hours: about 70 + 2 = 72 hours in total.
- Semantic models fall from about 13 to about 11 hours.
Answer: Two hours move from semantic models to preparing data, which now has about 72 hours; the six hours she is behind are made up in August.
Worked problem
Checking the budget by hand
Using weight times the gap plus one, with weights 27.5, 47.5 and 27.5 and gaps 3, 5 and 1, how many of the 110 hours go to preparing data?
Show solution
- Need for maintaining the solution: 27.5 × (3 + 1) = 110.
- Need for preparing data: 47.5 × (5 + 1) = 285.
- Need for semantic models: 27.5 × (1 + 1) = 55.
- Total need: 110 + 285 + 55 = 450.
- Hours for preparing data: 110 × 285 ÷ 450 ≈ 69.7.
Answer: About 70 hours, a little under two thirds of the budget.
Inside an area
An area's hours are not spread evenly over its skills. The study guide lists the skills under each area, and Keiko rated each one as done (she has used it and could explain it), seen (she has read about it or watched it once) or not met. Across the three areas she counted 39 skills on the current outline as she reconstructed it from the certification page and the older study guide: 15 done, 17 seen and 7 not met. The seven not met were querying an eventhouse with KQL, creating views and functions in a lakehouse SQL endpoint, choosing between file partitioning schemes, Delta table file size problems, Power BI project files, reusable templates and data source files, and the XMLA endpoint for querying rather than deploying.
Within each area, hours go first to skills not met, then to seen skills, and last to done skills, which mostly get practice items. The skills not met get a short lesson from the course material, a lab from lesson 10 and a set of practice items. Seen skills get practice items and, if those go badly, a lab. Done skills get only practice items until a checkpoint shows a problem.
| Rating | Count | Treatment |
|---|---|---|
| Done | 15 | Practice items only |
| Seen | 17 | Practice items, then a lab if results are weak |
| Not met | 7 | Course material review, a lab, then practice items |
When the weights change
If Microsoft publishes a new outline or new weights before October, Keiko will rerun the budget. The listing above takes only a minute to change: new weights, new scores from the latest checkpoint, the hours left. Marisol also suggested a simple sensitivity check now. If preparing data turns out to be 40 to 45 parts in 100, as on the older study guide page, rather than 45 to 50, its hours fall from about 70 to about 66, and the plan barely changes. The ranking of the areas is what matters, and that is the same on both versions.
There is one change that would matter more. If a future update moved KQL and eventhouses out of DP-600 entirely, about six of the seventy hours planned for preparing data would move elsewhere. That is another reason to check the study guide a month before the exam: not to start the plan again, but to move a few hours.
Common mistakes
MistakeA weight of 45 to 50 means there will be 45 to 50 items from that area.
InsteadWeights are shares of points, not counts of items, and items can be worth more than one point.
MistakeGive a strong area zero hours.
InsteadKeep every area in the plan; skills fade and a diagnostic can flatter.
MistakeThe weights on a third-party guide are official.
InsteadThey are estimates; use them for ranking and rough sizing, and check Microsoft's study guide before booking.
MistakeSpread an area's hours evenly over its skills.
InsteadRate each skill as done, seen or not met and give the most time to skills not met.
MistakeOnce the budget is set, keep it fixed.
InsteadRerun it at each checkpoint and whenever the outline changes.
Summary and key terms
- Weights are shares of the exam's points; use the midpoints of the ranges, scaled to 100, for planning.
- With third-party estimates, preparing data is about 46 in 100 of the exam and the other two areas about 27 each.
- Weight times the gap plus one gives larger and weaker areas more time without dropping any area to zero.
- For Keiko, 110 hours split into about 27 for maintaining the solution, 70 for preparing data and 13 for semantic models.
- Within an area, rate each skill as done, seen or not met and spend the most on skills not met.
- Rerun the budget at each checkpoint and whenever the study guide changes; the ranking of areas matters more than exact hours.
- Weight
- The share of an exam's points that come from one skill area, given as a range.
- Midpoint
- The middle of a weight range, used as a planning estimate.
- Gap
- The difference between a target score and the current score in an area.
- Study budget
- A plan that shares the available study hours among skill areas.
- Sensitivity check
- Testing whether a plan changes much if an estimate turns out to be different.
Practice problems
Work each problem on paper first, then reveal the answer to check.
What are the midpoints of ranges 25 to 30 and 45 to 50?
Show answer
27.5 and 47.5.
Why use the gap plus one rather than the gap?
Show answer
So an area with a small gap still gets some time.
About how many hours go to preparing data in Keiko's plan?
Show answer
About 70 of 110.
How many of Keiko's 39 skills are not met?
Show answer
Seven.
If preparing data were weighted 40 to 45, would the plan change much?
Show answer
Not much; its hours fall to about 66 and the ranking stays the same.
Lesson quiz · 5 questions
Score 60% or more to complete this lesson.
Create a free account to save your progress, take quizzes and earn a certificate.