
JS-260 · Lesson 9 of 12 · 27 min
Monitoring and error tracking
▶ Video coming soon A video version of this lesson is on the way.
On Tuesday, October 31, Mira replays September 15 one more time, now with a question: how could the studio have known in the first minute, rather than in the fortieth when Rosa phoned? Every board request that afternoon failed with the same error, invalid board token, and every failure was written to the service's log. The information existed. Nobody was looking at it, and nothing was set up to look on their behalf. Today's lesson is about monitoring: collecting the signals that show whether the software is working for its users, and turning the important ones into alerts that reach a person.
What to watch
A service can be watched from outside, by trying it the way a user would, and from inside, by recording what it does. Both are needed, because each misses things the other sees. For a request-handling service like the partner API, Google's site reliability engineers suggested four golden signals, and they are a good starting list.
| Signal | Question | Partner service example |
|---|---|---|
| Latency | How long do requests take, including failed ones? | 95th-percentile time for POST /orders |
| Traffic | How much demand is there? | Requests per minute, board streams open |
| Errors | What share of requests fail? | 5xx responses, and 401s on the board |
| Saturation | How full is the service? | Database connections in use out of 10, event loop delay |
A shorter version for services is RED: rate, errors and duration. For resources such as a server's CPU, memory and disk, the matching list is USE: utilization, saturation and errors. Theo's server already reports USE figures to his hosting provider's dashboard; the studio's work is the RED side for the services it wrote.
Health checks: liveness and readiness
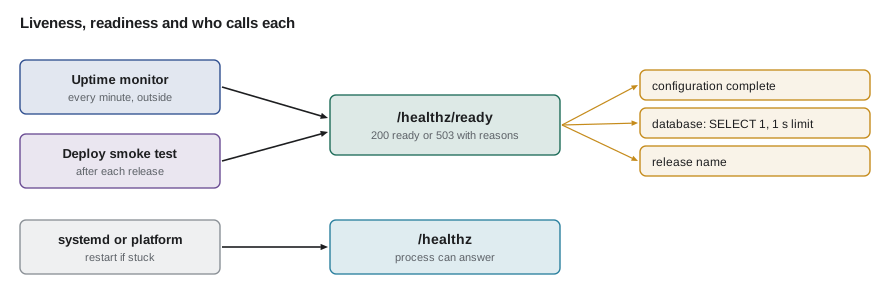
JS-230 gave the partner service one health endpoint, /healthz, checked every minute, and on September 15 it said everything was fine. The lesson is that one check cannot answer two different questions. A liveness check asks whether the process is alive enough to answer at all; if not, something should restart it. A readiness check asks whether it can do its job right now: is its configuration complete, can it reach its database, is it the expected release? If not, traffic should not be sent to it, and someone should look.
// src/health.mjs: liveness and readiness for the partner service
import http from 'node:http';

const release = process.env.RELEASE ?? 'dev';
const startedAt = Date.now();

async function checkDatabase() {
  // The real service runs SELECT 1 with a 1-second statement timeout.
  if (process.env.SIMULATE_DB === 'down') throw new Error('connect ECONNREFUSED 10.0.4.12:5432');
  return 'ok';
}
async function checkBoardSecret() {
  return (process.env.BOARD_TOKEN_SECRET ?? '').length >= 32 ? 'ok' : 'missing';
}

http.createServer(async (req, res) => {
  if (req.url === '/healthz') {                       // liveness: is the process able to answer at all?
    res.writeHead(200, { 'content-type': 'text/plain' }).end('ok');
    return;
  }
  if (req.url === '/healthz/ready') {                 // readiness: can it do its work?
    const checks = {};
    try { checks.db = await checkDatabase(); } catch (err) { checks.db = `error: ${err.message}`; }
    checks.boardSecret = await checkBoardSecret();
    const ready = Object.values(checks).every((v) => v === 'ok');
    res.writeHead(ready ? 200 : 503, { 'content-type': 'application/json', 'cache-control': 'no-store' });
    res.end(JSON.stringify({ status: ready ? 'ready' : 'not ready', release, uptimeS: Math.floor((Date.now() - startedAt) / 1000), checks }));
    return;
  }
  res.writeHead(404).end();
}).listen(Number(process.env.PORT ?? 3100), '127.0.0.1');
What this code does
The liveness endpoint answers ok without touching anything else, so it fails only if the process itself is stuck. The readiness endpoint checks the database and the board secret, reports each result and the running release, and answers 503 if any check fails. It is marked no-store so no cache can ever answer for it.
$ curl -s -i http://127.0.0.1:3193/healthz | head -1
HTTP/1.1 200 OK
$ curl -s http://127.0.0.1:3193/healthz/ready; echo
{"status":"not ready","release":"1.12.0-4e1d2c9","uptimeS":0,"checks":{"db":"ok","boardSecret":"missing"}}
$ curl -s -o /dev/null -w "%{http_code}\n" http://127.0.0.1:3194/healthz
200
$ curl -s -w "\n%{http_code}\n" http://127.0.0.1:3194/healthz/ready
{"status":"not ready","release":"1.12.0-4e1d2c9","uptimeS":0,"checks":{"db":"error: connect ECONNREFUSED 10.0.4.12:5432","boardSecret":"ok"}}
503
What this code does
The first server starts the way production did on September 15, without the board secret: liveness answers 200, but readiness reports the missing secret and the database result. The second has the secret but cannot reach its database. Its liveness check still passes while readiness answers 503 and says exactly why, which is what the smoke test and the uptime monitor need to know.
Two cautions come with readiness checks. They should be cheap, because they run every few seconds; SELECT 1 with a short timeout, not a real query. And they should check only what this service itself needs: if the partner service's readiness also checked Theo's mail provider, a mail outage would mark the order API as down even though orders can still be taken.
// Combine individual checks into one readiness answer, with timeouts and optional checks.
function readiness(results) {
  const failed = results.filter((r) => r.status !== 'ok');
  const critical = failed.filter((r) => r.critical);
  const status = critical.length ? 'not ready' : failed.length ? 'degraded' : 'ready';
  return { status, http: critical.length ? 503 : 200, failed: failed.map((r) => `${r.name}: ${r.status}`) };
}

const withTimeout = (name, ms, critical, limit = 1000) => ({ name, critical, status: ms > limit ? `timeout after ${limit} ms` : 'ok' });
console.log(readiness([withTimeout('db', 12, true), withTimeout('config', 0, true), withTimeout('mail outbox', 40, false)]));
console.log(readiness([withTimeout('db', 12, true), withTimeout('config', 0, true), withTimeout('mail outbox', 5000, false)]));
console.log(readiness([withTimeout('db', 2400, true), withTimeout('config', 0, true), withTimeout('mail outbox', 40, false)]));{ status: "ready", http: 200, failed: [] }
{ status: "degraded", http: 200, failed: [ "mail outbox: timeout after 1000 ms" ] }
{ status: "not ready", http: 503, failed: [ "db: timeout after 1000 ms" ] }What this code does
Each check reports a status, and slow checks are treated as failures after a one-second limit so a hung database cannot hang the health endpoint too. A failed optional check, such as the mail outbox, makes the service degraded but still ready, so traffic keeps flowing. Only a failed critical check returns 503.
Checking from outside
Internal checks can all pass while users still cannot reach the service, for example if the web server's configuration or a certificate is wrong. Synthetic monitoring, also called uptime monitoring, runs scripted checks against the public addresses from outside, every minute, from more than one location. The studio's monitor checks the public home page, the portal's config.json, the partner API's readiness through the web server, the donation function's own health URL, and the expiry date of every certificate, alerting 21 days before any expires.
The order board needs a check of its own, because its failure on September 15 was invisible to every request-and-response check. Its synthetic check signs in as a test board device, opens the event stream and expects the 25-second heartbeat from JS-240 within 30 seconds. If no heartbeat arrives, the board is broken for Rosa, whatever the other checks say.
Error tracking
Logs record everything; error tracking picks out the failures and organizes them. An error tracking service receives a report each time code throws an error that nobody handles, or calls a function to report one deliberately, with the stack trace, the release, the environment, the browser or server, and what the user was doing just before. It groups reports that have the same cause into one issue, counts them, shows when the issue first appeared and in which release, and alerts when a new one appears. Sentry is the best-known service, available as a hosted product or self-hosted, and there are open-source alternatives that accept the same client libraries.
// Group error reports by a fingerprint: the error type, a normalized message and the top stack frame.
const reports = [
  { type: 'TokenError', message: 'invalid board token for device 7f3a', frame: 'src/board/auth.mjs:41', release: '1.12.0' },
  { type: 'TokenError', message: 'invalid board token for device 7f3a', frame: 'src/board/auth.mjs:41', release: '1.12.0' },
  { type: 'TokenError', message: 'invalid board token for device 91cc', frame: 'src/board/auth.mjs:41', release: '1.12.0' },
  { type: 'TypeError', message: "Cannot read properties of undefined (reading 'trays')", frame: 'src/orders/fair-share.mjs:88', release: '1.12.0' },
  { type: 'TokenError', message: 'invalid board token for device 7f3a', frame: 'src/board/auth.mjs:41', release: '1.12.0' },
];

const normalize = (m) => m.replace(/\b[0-9a-f]{4,}\b/g, '<id>').replace(/\d+/g, '<n>');
const groups = new Map();
for (const r of reports) {
  const key = `${r.type}|${normalize(r.message)}|${r.frame}`;
  const g = groups.get(key) ?? { ...r, message: normalize(r.message), count: 0 };
  g.count++;
  groups.set(key, g);
}
for (const g of [...groups.values()].sort((a, b) => b.count - a.count)) {
  console.log(String(g.count).padStart(3), g.type, '-', g.message, `(${g.frame}, first in ${g.release})`);
}4 TokenError - invalid board token for device <id> (src/board/auth.mjs:41, first in 1.12.0) 1 TypeError - Cannot read properties of undefined (reading 'trays') (src/orders/fair-share.mjs:88, first in 1.12.0)
What this code does
Device ids and numbers are replaced with placeholders, so reports that differ only in those details get the same fingerprint. Grouping by the error type, the normalized message and the top stack frame turns five reports into two issues, sorted by how often they occur. On September 15 the board's issue would have appeared with a new release and a rapidly growing count within the first minute.
For the portal, the error tracker's browser library is set up when the app starts, with the release name from config.json so each error is tied to the build that produced it, and the hidden source maps from lesson 2 are uploaded by the pipeline for that release, so stack traces point at Mira's real source lines. For the Node services, unhandled errors are reported and the process then exits, because after an uncaught exception its state cannot be trusted; systemd restarts it.
Error reports can carry personal data: a URL with a volunteer's name in it, a request body with an agency contact, a dietary note. The studio's rules from JS-250's real-user monitoring apply: no names, emails, IP addresses or request bodies are sent; the client library's scrubbing removes cookies and authorization headers; and the tracker keeps events for 90 days. This keeps the Food Hub within its PIPEDA obligations for meaningful consent and limited collection, as described in WEB-101.
Metrics, traces and OpenTelemetry
Error tracking and logs record individual events. Metrics are numbers sampled or counted over time: requests per minute, error count, a histogram of request durations, open database connections. They are cheap to store, fast to chart and the usual basis for alerts. Traces follow one request through every service it touches, as a tree of timed spans, which shows where the time went when a request is slow.
OpenTelemetry is the vendor-neutral standard for producing all three kinds of signal, with APIs and SDKs for each language and a common wire format, so instrumented code can send its data to any compatible back end. In 2026 its JavaScript SDK reached version 3.0, which requires Node.js 22.15 or later and made logs stable alongside traces and metrics. The studio instruments the partner service with OpenTelemetry's Node.js SDK and its automatic instrumentation for HTTP and PostgreSQL, so every request produces a trace and the standard HTTP metrics without hand-written timing code.
// src/telemetry.mjs: loaded before the service with node --import ./src/telemetry.mjs src/server.mjs
import { NodeSDK } from '@opentelemetry/sdk-node';
import { getNodeAutoInstrumentations } from '@opentelemetry/auto-instrumentations-node';
import { OTLPTraceExporter } from '@opentelemetry/exporter-trace-otlp-http';

const sdk = new NodeSDK({
  serviceName: 'partner-orders',
  traceExporter: new OTLPTraceExporter({ url: process.env.OTEL_EXPORTER_OTLP_TRACES_ENDPOINT }),
  instrumentations: [getNodeAutoInstrumentations({ '@opentelemetry/instrumentation-fs': { enabled: false } })],
});
sdk.start();

process.on('SIGTERM', () => { sdk.shutdown().finally(() => process.exit(0)); });
What this code does
The file starts the OpenTelemetry SDK before the service's own code loads, which is why it is passed to node with --import. Automatic instrumentations wrap the HTTP server, the PostgreSQL client and other common libraries so their work appears as spans, while file-system spans are turned off as noise. Traces are sent with the OTLP protocol to an endpoint given in the environment, and shutdown flushes anything still buffered.
Service level objectives and error budgets
Alerts need thresholds, and thresholds need a definition of good enough. A service level indicator (SLI) measures what users experience, such as the share of board requests that succeed within one second. A service level objective (SLO) sets a target for it over a period, such as 99.5 in 100 over 28 days. The gap between perfection and the target is the error budget: the amount of failure the service may have in the period without missing the objective. While budget remains, the team can ship changes freely; when it is nearly spent, reliability work comes first.
// Error budget for the board: target 99.5 in 100 good requests over 28 days.
const target = 0.995;
const days = 28;
const total = 268800;          // board requests in the window (about 9,600 a day)
const bad = 610;               // failed or slower than 1 second

const allowed = Math.floor(total * (1 - target));
const left = allowed - bad;
console.log('allowed bad requests:', allowed);
console.log('used:', bad, `(${Math.round((bad / allowed) * 100)} in 100 of the budget)`);
console.log('left:', left);
const minutes = days * 24 * 60 * (1 - target);
console.log('as complete downtime, the budget is about', Math.round(minutes), 'minutes in', days, 'days');allowed bad requests: 1344 used: 610 (45 in 100 of the budget) left: 734 as complete downtime, the budget is about 202 minutes in 28 days
What this code does
The budget is the number of requests that may fail while still meeting 99.5 in 100, here 1,344 in the window. September 15's outage alone used most of the 610 already spent. Expressed as time, the same objective allows about three and a third hours of complete outage in 28 days, which shows that a single forty-minute failure is a large share of it.
Alerting directly on the budget works better than alerting on raw error counts. A burn rate is how fast the budget is being used compared with the steady rate that would use it exactly by the end of the period: a burn rate of 1 spends the whole budget in 28 days, and a burn rate of 14.4 would spend 2 in 100 of it in an hour. A widely used pattern, from Google's site reliability workbook, pages someone when the burn rate is high over both a long window and a short one, so that a real, ongoing problem alerts quickly while a brief blip that has already stopped does not.
// Multi-window burn rate alerting: page only if both windows are burning fast.
const budget = 1 - 0.995;
function burnRate(good, total) { return total === 0 ? 0 : (1 - good / total) / budget; }

function decide(longWindow, shortWindow) {
  const long = burnRate(...longWindow), short = burnRate(...shortWindow);
  const page = long >= 14.4 && short >= 14.4;
  return `1 h burn ${long.toFixed(1)}, 5 min burn ${short.toFixed(1)} -> ${page ? 'PAGE' : 'no page'}`;
}

console.log('Sept 15, 15:10 ', decide([310, 420], [0, 40]));      // board failing since 15:04
console.log('brief blip     ', decide([330, 400], [40, 40]));     // errors earlier, already stopped
console.log('normal day ', decide([399, 400], [40, 40]));Sept 15, 15:10 1 h burn 52.4, 5 min burn 200.0 -> PAGE brief blip 1 h burn 35.0, 5 min burn 0.0 -> no page normal day 1 h burn 0.5, 5 min burn 0.0 -> no page
What this code does
Each window is given as good and total requests, and its burn rate is the error share divided by the budget share. On September 15, both the last hour and the last five minutes were burning far above 14.4, so the alert would have paged someone about six minutes after the failure began. A burst of errors that has already stopped keeps the long window high for a while but not the short one, so nobody is woken for it.
Alerts that reach a person
An alert is only useful if it is rare enough to be taken seriously and specific enough to act on. The studio's rules: alert on symptoms users feel, such as the board's SLO burning or the readiness check failing from outside, not on causes such as high CPU; send everything to the team's chat channel; and page a person by phone only for the few alerts that need action within the hour. Every alert links to a short runbook page saying what it means and what to check first. During December, the phone alerts go to a rota of Gareth and Mira, with Theo's number kept for nothing short of a lost server.
Worked problem
How much faster would September 15 have been noticed?
The board began failing at 15:04. With the new monitoring, three things would have reacted: the error tracker sends an alert for a new issue with more than 20 events in 5 minutes, and the board was making about 8 requests a minute; the board's synthetic check runs every minute and alerts after 2 consecutive failures; and the burn-rate alert is evaluated every minute. Which alert fires first, and roughly when?
Show solution
- Error tracker: 20 events at 8 per minute takes 20 / 8 = 2.5 minutes, so about 15:07.
- Synthetic check: first failure at the next run, by 15:05; second at 15:06; alert about 15:06.
- Burn rate: the 5-minute window passes 14.4 within a minute or two, and the 1-hour window needs enough failed requests in the hour, which takes several minutes more; about 15:10.
- First alert: the synthetic check at about 15:06.
Answer: The synthetic board check would have alerted at about 15:06, two minutes after the failure began, instead of Rosa's call at 15:41, and the error tracker's issue would already have shown the cause: invalid board token in release 1.12.0.
Common mistakes
MistakeUsing one health check for both liveness and readiness.
InsteadAnswer liveness without dependencies, and check configuration, database and release for readiness.
MistakeMaking readiness depend on every external service.
InsteadCheck only what this service needs to do its own work, with short timeouts.
MistakeSending personal data in error reports.
InsteadScrub cookies, authorization headers, bodies and names before reports leave the device or server.
MistakeAlerting on every error.
InsteadAlert on user-facing symptoms such as SLO burn rates, and page only for what needs action within the hour.
MistakeMonitoring only from inside.
InsteadAdd synthetic checks from outside, including the board's stream and certificate expiry.
Summary and key terms
- Monitoring collects the signals that show whether software works for its users and turns the important ones into alerts.
- The golden signals of latency, traffic, errors and saturation, or RED for services, are a good start.
- Liveness checks only that the process answers; readiness checks configuration, the database and the release, returns 503 when the service cannot work, and should be cheap and limited to the service's own needs.
- Synthetic checks test the public addresses from outside, including the board's event stream and certificate expiry.
- Error tracking groups failures into issues by fingerprint, tied to releases and readable through source maps, with personal data scrubbed.
- OpenTelemetry produces traces, metrics and logs in a vendor-neutral way.
- SLOs define good enough, error budgets measure what is left, and multi-window burn-rate alerts page people only for real, ongoing problems.
- Golden signals
- Latency, traffic, errors and saturation: four measures of a request-handling service.
- Liveness check
- A check that the process can answer at all, used to decide whether to restart it.
- Readiness check
- A check that the service can do its work now, including its essential dependencies.
- Synthetic monitoring
- Scripted checks run regularly from outside against the public service.
- Error tracking
- Collecting unhandled errors with context and grouping them into issues.
- OpenTelemetry
- A vendor-neutral standard and set of SDKs for traces, metrics and logs.
- Service level objective (SLO)
- A target for a service level indicator over a period, such as 99.5 in 100 good requests in 28 days.
- Error budget
- The amount of failure allowed in a period while still meeting the SLO.
Practice problems
Work each problem on paper first, then reveal the answer to check.
Why did the September 15 health check pass?
Show answer
It was a liveness check: it confirmed the process answered, not that it could sign board tokens.
Why shouldn't the partner service's readiness depend on the mail provider?
Show answer
A mail outage would mark the order API as down even though orders could still be taken.
What does a burn rate of 1 mean?
Show answer
The error budget is being used at exactly the rate that would spend it by the end of the period.
Why are portal error reports tagged with the release?
Show answer
So each error can be tied to the build that caused it and its source maps.
Try it yourself
Fingerprint an error message
Complete fingerprint(type, message) so that errors differing only in ids and numbers get the same fingerprint. Replace any run of 4 or more hexadecimal characters forming a whole word with <id>, then any remaining run of digits with <n>, and return type: message.
The program prints the fingerprints of four errors; the first two should match.
function fingerprint(type, message) {
  return `${type}: ${message}`;
}

console.log(fingerprint('TokenError', 'invalid board token for device 7f3a'));
console.log(fingerprint('TokenError', 'invalid board token for device 91cc'));
console.log(fingerprint('CapacityError', 'day 2028-12-13 has 3 trays left'));
console.log(fingerprint('TypeError', 'cannot read trays'));
Try it yourself
How much budget is left?
Complete budget(target, total, bad) so that it returns a string like allowed 50, used 20, left 30. The allowed number of bad requests is total × (1 − target), rounded down.
If more bad requests occurred than allowed, show the remaining budget as a negative number, followed by (objective missed).
function budget(target, total, bad) {
  return '';
}

console.log(budget(0.995, 10000, 20));
console.log(budget(0.999, 120000, 95));
console.log(budget(0.995, 4000, 31));
Lesson quiz · 5 questions
Score 60% or more to complete this lesson.
Create a free account to save your progress, take quizzes and earn a certificate.