
JS-260 · Lesson 10 of 12 · 28 min
Logging in production
▶ Video coming soon A video version of this lesson is on the way.
On Thursday, November 2, Theo shows Mira what he did on September 15 once Rosa had phoned. He connected to the server, ran journalctl for the partner service, and scrolled through about eleven thousand lines from the afternoon, most of them heartbeat messages, looking for anything that said token. It took him nine minutes to find the first failure. "The logs had the answer," he says. "They were just written for the person who wrote them, on the day they wrote them." Today's lesson is about logs that are useful in production: structured, consistent, safe to keep and easy to search.
Logs, metrics and traces
Lesson 9 introduced three kinds of signal. Metrics say how much and how often, cheaply, for charts and alerts. Traces say where the time went for one request. Logs say what happened, in detail, one event at a time: this order was created, that request was refused and why, this background job started and finished. Logs are the most detailed and the most expensive to store, and they are what people read when an alert has told them something is wrong and they need to know why.
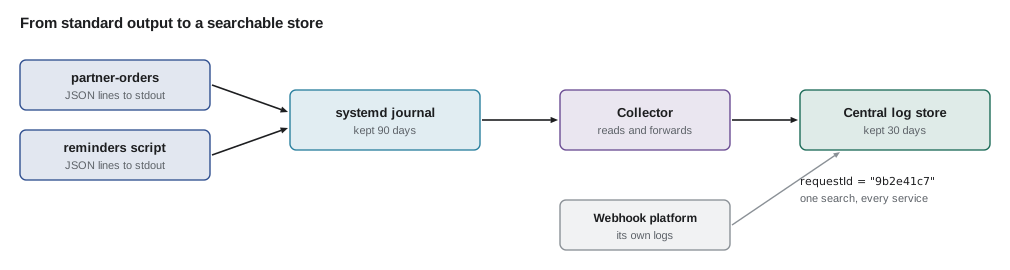
The twelve-factor rule for logs is short: a service should write its log as a stream of events to standard output and let the environment collect it. The partner service does not open log files or rotate them. Under systemd, the journal collects whatever the service prints, as JS-230 set up with 90 days of retention; in a container, the container runtime does the same; on a serverless platform, the platform does. The service stays the same in all three.
Structured logs
A line like Order 4471 created for northside in 84ms is easy to read and hard to search: finding all orders that took more than a second means writing a regular expression for every message format anyone ever used. A structured log line is a record with named fields, usually written as one JSON object per line. Every line has the same core fields, and each event adds its own.
| Field | Meaning | Example |
|---|---|---|
| time | When it happened, in UTC ISO 8601 | 2028-11-02T19:14:07.512Z |
| level | How important: 10 trace to 60 fatal | 30 (info) |
| msg | A short, fixed description of the event | order created |
| service, release | Which program and which version | partner-orders, 1.12.0-4e1d2c9 |
| requestId | Ties together every line about one request | 9b2e41c7 |
| traceId | Links the line to its OpenTelemetry trace | 4bf92f3577b34da6a3ce929d0e0e4736 |
| event fields | Whatever this event needs | orderId, agency, status, durationMs |
Two habits make structured logs work. The message is fixed and the details go in fields: msg is order created for every order, never Order 4471 created, so searching for one kind of event is a simple equality. And field names are shared across services, so a search for requestId finds lines from the web server, the partner service and Theo's application alike. The partner service uses pino, a fast JSON logger for Node.js; the small logger below writes the same shape and runs without any packages.
// src/log.mjs: a small structured logger (the service uses pino, which writes the same shape)
const LEVELS = { trace: 10, debug: 20, info: 30, warn: 40, error: 50, fatal: 60 };
const threshold = LEVELS[process.env.LOG_LEVEL ?? 'info'];
const now = () => process.env.FAKE_NOW ?? new Date().toISOString();
const SECRET_KEYS = /^(authorization|cookie|password|token|secret|apiKey)$/i;

function redact(value) {
  if (Array.isArray(value)) return value.map(redact);
  if (value && typeof value === 'object') {
    return Object.fromEntries(Object.entries(value).map(([k, v]) => [k, SECRET_KEYS.test(k) ? '[redacted]' : redact(v)]));
  }
  return value;
}

export function logger(bindings = {}) {
  const write = (level) => (msg, fields = {}) => {
    if (LEVELS[level] < threshold) return;
    const line = { time: now(), level: LEVELS[level], msg, ...bindings, ...redact(fields) };
    process.stdout.write(JSON.stringify(line) + '\n');
  };
  const log = Object.fromEntries(Object.keys(LEVELS).map((l) => [l, write(l)]));
  log.child = (more) => logger({ ...bindings, ...more });
  return log;
}
What this code does
Each level has a number, and lines below the threshold set by LOG_LEVEL are dropped before any work is done. Every line is one JSON object with the time, the numeric level, the message, the logger's bindings and the event's fields, with any field named like a credential replaced by [redacted] at any depth. child creates a logger that adds more bindings, such as a request id, to every line it writes.
// demo.mjs: what one order request writes to the log
import { logger } from './src/log.mjs';

const base = logger({ service: 'partner-orders', release: '1.12.0-4e1d2c9' });
const log = base.child({ requestId: '9b2e41c7', agency: 'northside' });

log.debug('parsed body', { lines: 2 });
log.info('order received', { method: 'POST', path: '/api/partners/v1/orders', headers: { authorization: 'Bearer pk_live_northside_51c0ffee' } });
log.warn('delivery day nearly full', { date: '2028-12-13', traysLeft: 3 });
log.info('order created', { orderId: 'ord_4471', status: 201, durationMs: 84 });
What this code does
A base logger carries the service name and release, and a child logger adds the request id and agency, so every line about this request carries both without repeating them. The debug line is dropped because the threshold is info. The authorization header was passed in by mistake, as happens, and the logger redacted it; piping the output through jq then selects only the warning.
$ FAKE_NOW=2028-11-02T19:14:07.512Z node demo.mjs
{"time":"2028-11-02T19:14:07.512Z","level":30,"msg":"order received","service":"partner-orders","release":"1.12.0-4e1d2c9","requestId":"9b2e41c7","agency":"northside","method":"POST","path":"/api/partners/v1/orders","headers":{"authorization":"[redacted]"}}
{"time":"2028-11-02T19:14:07.512Z","level":40,"msg":"delivery day nearly full","service":"partner-orders","release":"1.12.0-4e1d2c9","requestId":"9b2e41c7","agency":"northside","date":"2028-12-13","traysLeft":3}
{"time":"2028-11-02T19:14:07.512Z","level":30,"msg":"order created","service":"partner-orders","release":"1.12.0-4e1d2c9","requestId":"9b2e41c7","agency":"northside","orderId":"ord_4471","status":201,"durationMs":84}
$ FAKE_NOW=2028-11-02T19:14:07.512Z node demo.mjs | jq -c 'select(.level >= 40) | {msg, date, traysLeft, requestId}'
{"msg":"delivery day nearly full","date":"2028-12-13","traysLeft":3,"requestId":"9b2e41c7"}
The jq query is the point. With structured lines, questions become filters: everything at warning level or above, every line for request 9b2e41c7, every order slower than 500 milliseconds. On September 15, the query select(.msg == "board token rejected") would have found the first failure in a second instead of nine minutes.
Levels and what goes in each
Levels let one service write detailed logs when someone is investigating and quiet ones the rest of the time. The studio uses them like this: error for failures that need a person to look, such as an unhandled exception or a database that cannot be reached; warn for things that are unusual but handled, such as a delivery day nearly full or a retried call to Theo's API; info for the events that describe what the service did, one or two per request; and debug for detail only needed while investigating, turned on by setting LOG_LEVEL and restarting.
// Level filtering: numbers make comparisons simple.
const LEVELS = { trace: 10, debug: 20, info: 30, warn: 40, error: 50, fatal: 60 };
const lines = [
  { level: 20, msg: 'parsed body' },
  { level: 30, msg: 'order received' },
  { level: 40, msg: 'delivery day nearly full' },
  { level: 30, msg: 'order created' },
  { level: 50, msg: 'board token rejected' },
  { level: 20, msg: 'heartbeat sent' },
];

for (const threshold of ['debug', 'info', 'warn', 'error']) {
  const kept = lines.filter((l) => l.level >= LEVELS[threshold]);
  console.log(`LOG_LEVEL=${threshold}`.padEnd(16), kept.length, 'lines:', kept.map((l) => l.msg).join('; '));
}LOG_LEVEL=debug 6 lines: parsed body; order received; delivery day nearly full; order created; board token rejected; heartbeat sent LOG_LEVEL=info 4 lines: order received; delivery day nearly full; order created; board token rejected LOG_LEVEL=warn 2 lines: delivery day nearly full; board token rejected LOG_LEVEL=error 1 lines: board token rejected
What this code does
Because each level is a number, keeping a line is a single comparison with the threshold's number. Raising the threshold from debug to info drops the parsing and heartbeat noise, which on a busy day is most of the volume. At error, only the line that needs a person remains.
The heartbeat lines that buried September 15 were logged at info. They are now debug, and the stream code counts heartbeats in a metric instead, which is the right signal for something that happens every 25 seconds per board.
Request ids and trace context
A single action, such as an agency submitting an order, produces log lines in several places: Theo's web server, the partner service and, for notifications, Theo's application and mail queue. A request id ties them together. Theo's web server already generates one and passes it to the partner service in the X-Request-Id header (JS-230); the service puts it in every log line for that request and passes it on in any call it makes, so a single search shows the whole story in order.
OpenTelemetry does the same for traces with the W3C Trace Context standard: a traceparent header carrying a trace id and the id of the calling span, which every instrumented service passes along. The studio's logger copies the current trace id into each line, so a slow trace in the tracing tool links straight to its log lines, and a log line links back to its trace.
// Follow one request through several services by its request id.
const logs = [
  { t: '19:14:07.498', service: 'web', requestId: '9b2e41c7', msg: 'request', path: '/api/partners/v1/orders' },
  { t: '19:14:07.503', service: 'web', requestId: 'aa17f002', msg: 'request', path: '/volunteer/config.json' },
  { t: '19:14:07.512', service: 'partner-orders', requestId: '9b2e41c7', msg: 'order received' },
  { t: '19:14:07.590', service: 'partner-orders', requestId: '9b2e41c7', msg: 'order created', orderId: 'ord_4471' },
  { t: '19:14:07.591', service: 'theo-app', requestId: '9b2e41c7', msg: 'notification queued', template: 'order-received' },
  { t: '19:14:07.596', service: 'web', requestId: '9b2e41c7', msg: 'response', status: 201 },
  { t: '19:14:07.601', service: 'web', requestId: 'aa17f002', msg: 'response', status: 200 },
];

const ms = (t) => { const [h, m, s] = t.split(':').map(Number); return ((h * 60 + m) * 60 + s) * 1000; };
const story = logs.filter((l) => l.requestId === '9b2e41c7');
const start = ms(story[0].t);
for (const l of story) console.log(`+${String(Math.round(ms(l.t) - start)).padStart(3)} ms`, l.service.padEnd(15), l.msg);+ 0 ms web request + 14 ms partner-orders order received + 92 ms partner-orders order created + 93 ms theo-app notification queued + 98 ms web response
What this code does
Lines from three services are mixed together, as they would be in a central log store. Filtering on one request id picks out that order's lines, and subtracting the first line's time shows how long each step took after the request arrived. The whole order took 98 milliseconds from the web server receiving it to its response.
What must never be logged
Logs are kept for months, copied to other systems and read by more people than the database. Anything written to them should be something the studio would be comfortable having on a screen in a meeting. The rules are short, and the logger enforces what it can.
- No secrets or tokens. No authorization headers, cookies, API keys, passwords or signed URLs. The logger redacts fields with those names, but the real rule is not to pass them in.
- No personal data the service does not need to log. Log a volunteer's or contact's id, not their name, email or phone number; never log dietary or health details from the uploaded forms in JS-240.
- No request or response bodies by default. Bodies are where personal data and secrets hide; log their size and a few chosen fields instead.
- Careful with URLs. Query strings can carry tokens and email addresses; the logger records the path and the names of query parameters, not their values.
// Redact URLs before logging: keep the path, drop query values and anything that looks like a token.
function safeUrl(raw) {
  const u = new URL(raw, 'https://riverside-food-hub.example');
  const params = [...u.searchParams.keys()].map((k) => `${k}=…`);
  const path = u.pathname.replace(/\/(reset|invite|download)\/[^/]+/g, '/$1/[token]');
  return params.length ? `${path}?${params.join('&')}` : path;
}

for (const url of [
  '/api/partners/v1/orders?cursor=MjAyOC0xMi0xMw&limit=25',
  '/account/reset/3f9a0c2e5b71d8e4',
  '/volunteer/shifts?email=lucy.tran%40riverside-food-hub.example',
  '/api/partners/v1/attachments/download/sig_7Hq2kVwL9pZx',
]) console.log(safeUrl(url));/api/partners/v1/orders?cursor=…&limit=… /account/reset/[token] /volunteer/shifts?email=… /api/partners/v1/attachments/download/[token]
What this code does
The URL is parsed, every query parameter keeps its name but loses its value, and path segments after words like reset or download, which usually hold one-time tokens, are replaced. A support person can still see which page was requested and with which parameters. An email address or a signed download link never reaches the log.
Collecting, shipping and keeping logs
On one server, journalctl is enough to read the logs: journalctl -u partner-orders -o cat prints the service's JSON lines, which jq can filter. With several services, a function on a serverless platform and a December during which Theo is away, the studio also ships logs to one place where they can be searched together. A small collector on the server reads the journal and forwards lines; the OpenTelemetry Collector, Vector and Fluent Bit are common choices. It sends them to a log store with a search interface. The function's platform forwards its logs to the same store.
journalctl -u partner-orders --since "2028-11-02 19:00" -o cat | jq -c 'select(.level >= 40)'
journalctl -u partner-orders -o cat | jq -r 'select(.requestId == "9b2e41c7") | "\(.time) \(.msg)"'
What this code does
journalctl reads the partner service's lines from the systemd journal, with -o cat printing only the messages, which are the JSON objects. The first command keeps warnings and errors since 19:00; the second prints the time and message of every line for one request. The same two questions are the most common ones people ask of logs during an incident.
| Where | Kept for | Who can read |
|---|---|---|
| systemd journal on Theo's server | 90 days (JS-230) | Theo, and the deploy user for its own service |
| Central log store | 30 days | The studio's developers |
| Error tracker events | 90 days | The studio's developers |
| Audit records in the database | Two years | Theo; reports for Paul on request |
The last row is different in kind. An audit record of who did what, such as Rosa lowering a day's capacity or an agency administrator approving a new staff member, is evidence, not debugging output. It belongs in the database with the data it describes, kept as long as that data's policy says, rather than in logs that are deleted after a month.
Too much logging
More logging is not always better. Every line costs time to write, money to store and attention to read past. A failure in a loop can write the same error thousands of times a minute, filling the journal and hiding everything else. The studio's logger handles that case by suppressing repeats: after the first few identical lines in a window, it counts the rest and writes one summary.
// Suppress repeated messages: log the first few, then summarize the rest per window.
function makeLimiter({ firstN = 3, windowMs = 60000 } = {}) {
  const seen = new Map();
  return function shouldLog(key, now) {
    let s = seen.get(key);
    if (!s || now - s.start >= windowMs) {
      const summary = s && s.suppressed ? `${key}: repeated ${s.suppressed} more times` : null;
      s = { start: now, count: 0, suppressed: 0 };
      seen.set(key, s);
      if (summary) console.log(summary);
    }
    s.count++;
    if (s.count <= firstN) return true;
    s.suppressed++;
    return false;
  };
}

const shouldLog = makeLimiter();
for (let i = 0; i < 40; i++) {
  const now = i * 2000;                       // one failure every 2 seconds
  if (shouldLog('board token rejected', now)) console.log(`${now / 1000} s board token rejected`);
}
shouldLog('board token rejected', 130000); // a later window starts and prints the last summary0 s board token rejected 2 s board token rejected 4 s board token rejected board token rejected: repeated 27 more times 60 s board token rejected 62 s board token rejected 64 s board token rejected board token rejected: repeated 7 more times
What this code does
Each message key has a window of one minute in which the first three lines are written and the rest only counted. When a new window begins, the count from the previous one is written as one summary line. Forty failures over 80 seconds become eight lines, and nothing about the problem is lost.
Worked problem
How much does structured logging cost to keep?
The partner service handles about 9,600 board requests and 700 other requests a day. Before the changes, it wrote 4 info lines per board request (including heartbeats) and 3 per other request, at about 180 bytes each. After, board requests write 0 info lines (heartbeats are debug and counted as metrics) and other requests write 2 info lines of about 320 bytes, because structured lines carry more fields. How much log data does it write per day before and after, and how much does the central store hold at 30 days?
Show solution
- Before: (9,600 × 4 + 700 × 3) × 180 = (38,400 + 2,100) × 180 = 7,290,000 bytes, about 7.3 MB a day.
- After: 700 × 2 × 320 = 448,000 bytes, about 0.45 MB a day.
- Thirty days after: 0.448 × 30 = 13.4 MB.
- Thirty days before would have been 7.29 × 30 = 219 MB.
Answer: About 0.45 MB a day instead of 7.3 MB, so 30 days of searchable logs is about 13 MB. Moving the noise into metrics and the detail into fields made the logs both smaller and more useful.
Common mistakes
MistakePutting details in the message text.
InsteadKeep msg fixed for each kind of event and put the details in named fields.
MistakeLogging heartbeats and other routine events at info.
InsteadLog them at debug, and count them with a metric.
MistakeLogging request bodies, headers or full URLs.
InsteadLog sizes, chosen fields and paths with query values removed.
MistakeWriting log files and rotating them in the service.
InsteadWrite to standard output and let systemd, the container runtime or the platform collect the stream.
MistakeKeeping audit records only in logs.
InsteadStore who-did-what records in the database with their own retention.
Summary and key terms
- Logs record events in detail and are what people read to find out why something went wrong.
- Services write them as a stream to standard output and let the environment collect them.
- Structured logs are one JSON object per line with shared fields: time, level, a fixed message, service, release, request id and trace id, plus event fields.
- Levels keep routine detail at debug and leave info, warn and error for what matters.
- Request ids and W3C Trace Context tie lines from several services to one request and its trace.
- Secrets, personal data, bodies and query values stay out, with the logger redacting what it can.
- A collector ships logs to a central store with defined retention, audit records belong in the database, and repeated lines are suppressed and summarized.
- Structured log
- A log made of records with named fields, usually one JSON object per line.
- Log level
- A rating of a line's importance, from trace and debug to error and fatal.
- Request id
- An identifier attached to every log line about one request, across services.
- Trace context
- The W3C standard traceparent header that carries trace and span ids between services.
- Redaction
- Removing or masking sensitive values before they are logged.
- Log collector
- A program that reads logs where they are written and forwards them to a store.
- Retention
- How long logs or records are kept before they are deleted.
- Audit record
- A durable record of who did what, kept as data rather than as a log line.
Practice problems
Work each problem on paper first, then reveal the answer to check.
Why is msg kept the same for every order created?
Show answer
So that one kind of event can be found with a simple equality search, with details in fields.
Why does the partner service write to standard output instead of a file?
Show answer
So systemd, a container runtime or a platform can collect it without the service changing.
What does a request id let someone do during an incident?
Show answer
Find every line about one request across the web server, the service and Theo's application, in order.
Why are query string values removed before logging a URL?
Show answer
They can contain tokens, email addresses and other sensitive values.
Try it yourself
Should this line be written?
Complete shouldLog(level, threshold) using the LEVELS table. It returns true if the line's level is at least the threshold's. If either name is not in the table, it throws an Error with the message unknown level NAME.
The program checks several pairs.
const LEVELS = { trace: 10, debug: 20, info: 30, warn: 40, error: 50, fatal: 60 };
function shouldLog(level, threshold) {
  return true;
}

for (const [l, t] of [['debug', 'info'], ['info', 'info'], ['error', 'warn'], ['trace', 'debug']]) console.log(l, t, shouldLog(l, t));
try { shouldLog('verbose', 'info'); } catch (err) { console.log('error:', err.message); }
Try it yourself
Read a traceparent header
A W3C traceparent header looks like 00-<32 hex trace id>-<16 hex span id>-<2 hex flags>. Complete parseTraceparent(header) so that it returns { traceId, spanId, sampled }, where sampled is true if the lowest bit of the flags is set.
Return null for anything malformed, including a version other than 00 or an all-zero trace id.
function parseTraceparent(header) {
  return null;
}

for (const h of [
  '00-4bf92f3577b34da6a3ce929d0e0e4736-00f067aa0ba902b7-01',
  '00-4bf92f3577b34da6a3ce929d0e0e4736-00f067aa0ba902b7-00',
  '00-00000000000000000000000000000000-00f067aa0ba902b7-01',
  '01-4bf92f3577b34da6a3ce929d0e0e4736-00f067aa0ba902b7-01',
  'not a header',
]) console.log(JSON.stringify(parseTraceparent(h)));
Lesson quiz · 5 questions
Score 60% or more to complete this lesson.
Create a free account to save your progress, take quizzes and earn a certificate.