
FIN-301 · Lesson 12 of 12 · 32 min
Managed portfolios, performance evaluation, regulation and capstone
Most people invest through someone else: a mutual fund, an exchange-traded fund, a pension plan or an adviser. This final lesson looks at managed portfolios from the client's side. It compares the main fund structures, shows how much fees cost over a lifetime, reviews the evidence on active and passive management, and explains the measures used to judge whether a manager has added value after accounting for risk. It then summarizes how investors are protected by regulation and professional standards, and closes with a capstone that brings the course together: building and evaluating a portfolio for an invented investor. As throughout the course, this is education, not personal investment advice.
Fund structures
A mutual fund pools investors' money and issues units or shares that are bought and redeemed at the fund's net asset value (NAV), calculated once a day. An exchange-traded fund (ETF) also pools assets, but its units trade on an exchange throughout the day, and authorized dealers create and redeem units in large blocks, which keeps the market price close to NAV. Most ETFs track an index, though actively managed ETFs have grown quickly. Closed-end funds issue a fixed number of shares that trade on an exchange, often at a discount or premium to NAV. Hedge funds are private, lightly regulated pools for wealthy and institutional investors that use leverage, short selling and derivatives, typically charging a management fee plus a share of profits. Segregated funds (in Canada) and variable annuities (in the United States) wrap funds in insurance contracts with guarantees, at extra cost.
Canadian mutual funds and ETFs are governed by provincial securities law and National Instrument 81-102, which limits leverage, concentration and illiquid holdings for most funds. Investors receive a Fund Facts document (ETF Facts for ETFs) setting out the management expense ratio (MER), risk rating and past performance. Since June 2022, funds can no longer be sold with deferred sales charges, and order-execution-only brokers cannot receive trailing commissions, reforms intended to reduce conflicts of interest.
The cost of fees
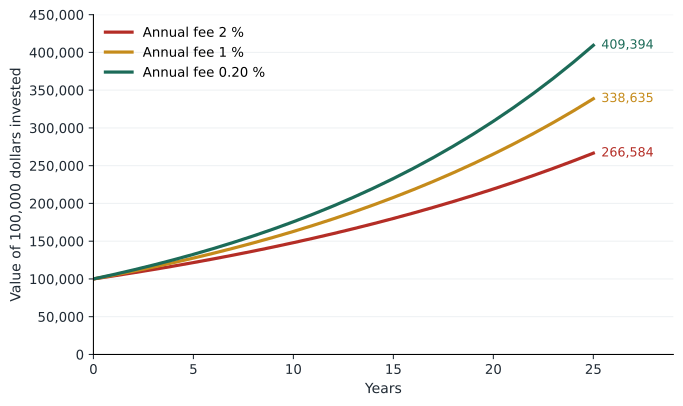
Fees come straight out of returns, every year, whatever the fund's performance, and they compound. A difference of one or two percentage points a year looks small but grows into a large share of ending wealth over a working life. Fees are expressed as an annual percentage of assets: the management expense ratio in Canada, or expense ratio in the United States, covers management, administration and, for many funds, advice or trailing commissions. Trading costs inside the fund are additional and are reported separately as a trading expense ratio.
Canadian fees have fallen but remain higher than in the United States, partly because many funds include the cost of advice. Morningstar Canada reported in 2025 that the average ETF charges about 0.66 % a year and active ETFs about 0.82 %, while fee-based mutual fund classes average about 1 % and commission-based classes close to 2 %. Broad-market index ETFs are available for well under 0.25 %.
Worked problem
Fee drag over 25 years
An investor puts $100,000 into a balanced fund earning 6 % a year before fees and leaves it for 25 years. Compare ending wealth with an MER of 2.0 %, 1.0 % and 0.2 %.
Show solution
- Net return 4.0 %: 100,000 × 1.04²⁵ = 266,584.
- Net return 5.0 %: 338,635.
- Net return 5.8 %: 409,394.
Answer: The 2 % fund leaves about $143,000 less than the 0.2 % fund, more than the original investment, unless it earns its fees through better returns or valuable advice.
Active versus passive management
An active manager tries to beat a benchmark by selecting securities or timing the market; a passive manager tries to match it at low cost. William Sharpe's arithmetic of active management, published in 1991, explains why active managers as a group must lag: before costs, the average actively managed dollar must earn the market return, because active and passive investors together hold the market and passive investors earn exactly the market. After costs, the average active dollar must therefore earn less. Some managers will beat the market, but identifying them in advance is hard, and past winners have rarely kept winning.
S&P Dow Jones Indices' SPIVA Canada scorecard for year-end 2025 found that 98.8 % of Canadian equity funds underperformed the S&P/TSX Composite over ten years, and similar shares of US and global equity funds sold in Canada trailed their benchmarks. Morningstar's research has also found that the expense ratio is one of the most reliable predictors of a fund's future relative performance.
These results do not prove markets are perfectly efficient: costs, career pressures and the difficulty of the task can explain them. Nor do they say active management has no place. Some investors value features that index funds lack, and in less efficient markets, such as small companies or some bond sectors, active managers may have more room. But the evidence explains the rapid growth of index funds and ETFs in both countries, and it puts the burden of proof on anyone charging higher fees.
Measuring risk-adjusted performance
Raw returns are not enough to judge a manager, because a manager can beat a benchmark simply by taking more risk. Four classic measures adjust for risk in different ways. The Sharpe ratio divides excess return by the standard deviation; it suits an investor whose whole portfolio is the fund. The Treynor ratio divides excess return by beta; it suits a fund that is one part of a diversified portfolio, where only systematic risk matters. Jensen's alpha is the return in excess of what the CAPM predicts for the fund's beta, the intercept of the regression in lesson 6; a multifactor version, from lesson 7, adjusts for size, value and momentum exposures. The information ratio divides alpha, or the return over the benchmark, by the tracking error, the standard deviation of the difference; it measures the consistency of a manager's value added. M², or Modigliani risk-adjusted performance, scales the fund to the market's volatility using the risk-free asset and reports the resulting return, which is easier to interpret than a ratio.
Worked problem
Comparing two managers
Over ten years, the risk-free rate averaged 2 % and the market returned 9 % with a standard deviation of 16 %. Fund A returned 11 % with standard deviation 20 % and beta 1.2. Fund B returned 9.5 % with standard deviation 13 % and beta 0.8. Compare them.
Show solution
- Sharpe: market 0.44; A = 9 ÷ 20 = 0.45; B = 7.5 ÷ 13 = 0.58.
- Treynor: market 7.0; A = 9 ÷ 1.2 = 7.5; B = 7.5 ÷ 0.8 = 9.4.
- Jensen's alpha: A = 11 − (2 + 1.2 × 7) = +0.6 %; B = 9.5 − (2 + 0.8 × 7) = +1.9 %.
- M² for B: scale to 16 % volatility: 2 + 0.58 × 16 = 11.2 %, 2.2 points above the market.
Answer: Fund A had the higher raw return, but Fund B delivered more return per unit of both total and systematic risk.
# Performance measures on seeded simulated monthly returns
import numpy as np
rng = np.random.default_rng(12)
months = 120
rf = np.full(months, 0.025 / 12)
mkt = rf + rng.normal(0.006, 0.045, months)
fund = rf + 0.0008 + 0.9 * (mkt - rf) + rng.normal(0, 0.015, months)   # small true alpha

def annual(x): return x.mean() * 12
ex_f, ex_m = fund - rf, mkt - rf
beta = np.cov(ex_f, ex_m)[0, 1] / ex_m.var(ddof=1)
alpha = annual(ex_f) - beta * annual(ex_m)
resid = ex_f - beta * ex_m
sharpe_f = annual(ex_f) / (fund.std(ddof=1) * np.sqrt(12))
sharpe_m = annual(ex_m) / (mkt.std(ddof=1) * np.sqrt(12))
treynor = annual(ex_f) / beta
info = alpha / (resid.std(ddof=1) * np.sqrt(12))
m2 = annual(rf) + sharpe_f * mkt.std(ddof=1) * np.sqrt(12)
t_alpha = (resid.mean() / (resid.std(ddof=1) / np.sqrt(months)))
print(f"beta {beta:.2f}  annual alpha {alpha:+.2%} (t = {t_alpha:.2f})")
print(f"Sharpe: fund {sharpe_f:.2f}, market {sharpe_m:.2f}   Treynor {treynor:.2%}")
print(f"information ratio {info:.2f} M-squared {m2:.2%} vs market {annual(mkt):.2%}")beta 0.85 annual alpha +1.21% (t = 0.78) Sharpe: fund 0.69, market 0.65 Treynor 10.80% information ratio 0.25 M-squared 12.53% vs market 11.87%
The simulation shows how hard it is to prove skill statistically. The fund was built with a true alpha of almost 1 % a year, yet after ten years of monthly data the t-statistic is unlikely to clear the conventional level of 2. With realistic levels of noise, it can take decades to separate a skilled manager from a lucky one, which is why investors should look at the process and costs behind a track record, not just the numbers.
Pitfalls in performance data
Several biases flatter reported fund performance. Survivorship bias: funds that perform badly are often merged or closed, so averages computed only from surviving funds overstate what investors actually earned. Benchmark choice: a manager who holds small companies but is measured against a large-company index can appear skilled in years when small companies do well. Backfill bias in hedge fund databases: funds report only after a good start. And time period: almost any strategy has looked good over some period. Performance attribution helps by splitting a portfolio's return relative to its benchmark into an allocation effect, from over- or under-weighting asset classes or sectors, and a selection effect, from picking better or worse securities within them.
Regulation and investor protection
Canadian securities regulation is provincial and territorial, coordinated through the Canadian Securities Administrators. Investment dealers and mutual fund dealers are overseen by the Canadian Investment Regulatory Organization (CIRO), formed in 2023 by the merger of IIROC and the MFDA. If a CIRO member firm becomes insolvent, the Canadian Investor Protection Fund (CIPF) protects eligible client property up to $1 million in each of three account categories: general accounts (including cash, margin and TFSA accounts), registered retirement accounts and RESPs. It does not protect against market losses or crypto assets. Complaints that a firm cannot resolve can go to the Ombudsman for Banking Services and Investments (OBSI).
Professional standards complement regulation. The CFA Institute's Code of Ethics and Standards of Professional Conduct, which charterholders in both countries must follow, require putting clients' interests first, exercising independent judgement, disclosing conflicts, dealing fairly and presenting performance accurately, including under the Global Investment Performance Standards described in lesson 3.
Capstone: building and evaluating a portfolio
Maya is 35, lives in Ontario, earns $95,000 a year and has $60,000 to invest for retirement, plus unused RRSP and TFSA room. She has an emergency fund, a long horizon and, by questionnaire and discussion, moderate risk aversion (A ≈ 3). She wants low costs and broad diversification. This invented case shows how the course's tools fit together; it is not advice for any real person.
Step 1, capital market assumptions: use the illustrative four-asset inputs from lesson 5, with a risk-free rate of 3 %. Step 2, the risky portfolio: the long-only tangency portfolio from lesson 5 holds roughly 12 % Canadian shares, 22 % US shares, 8 % international shares and 58 % bonds, with an expected return near 5.9 % and a standard deviation near 8.3 %. Step 3, the allocation: with A = 3, the optimal fraction in the risky portfolio is y* = (0.059 − 0.03) ÷ (3 × 0.083²), about 1.4, which would mean borrowing. Maya prefers not to use leverage, so she holds 100 % in the risky portfolio and tilts it toward shares, choosing a simpler 65 % equity and 35 % bond mix, spread across the three equity regions roughly in proportion to world market values with a modest home weighting. Step 4, implementation: three or four broad index ETFs with low fees. Step 5, location and accounts, set out below. Step 6, monitoring: rebalance annually or when any weight drifts more than five percentage points, and review the plan when her circumstances change.
For location, Maya fills her RRSP first, since her marginal tax rate today is probably higher than it will be in retirement, and holds most of the bonds and the US-share ETF there, avoiding US withholding tax on dividends under the treaty and sheltering fully taxed interest. Her TFSA holds Canadian and international shares, where tax-free growth is most valuable. If she later invests in a taxable account, Canadian shares, with their dividend tax credit and half-taxed capital gains, are the natural candidates.
Worked problem
Evaluating Maya's plan
Using the lesson 5 inputs, a 65/35 portfolio of 20 % Canadian, 30 % US and 15 % international shares plus 35 % bonds has an expected return of about 6.6 % and a standard deviation of about 11 %. With an all-in cost of 0.2 % and $6,000 added each year, estimate her wealth in 30 years and the range of outcomes.
Show solution
- Expected net return ≈ 6.5 %; deterministic projection ≈ $60,000 × 1.065³⁰ + $6,000 annuity ≈ $397,000 + $518,000 ≈ $915,000 (nominal).
- In real terms at 2 % inflation, roughly $500,000 in today's dollars.
- A seeded simulation in the program below gives the spread of outcomes, including the 5th and 95th percentiles.
Answer: The simulated median, about $824,000, is below the deterministic $915,000 because volatility pulls the typical compound return below the average return, as lesson 3 showed. The range runs from about $400,000 at the 5th percentile to about $1.75 million at the 95th, a reminder that a plan must survive bad sequences of returns, not just average ones.
# Monte Carlo projection of Maya's 65/35 plan (illustrative inputs, education only)
import numpy as np
rng = np.random.default_rng(2026)
years, sims = 30, 20000
mu, sigma, cost = 0.067, 0.11, 0.002
r = rng.normal(mu - cost, sigma, (sims, years))
wealth = np.full(sims, 60_000.0)
for t in range(years):
    wealth = wealth * (1 + r[:, t]) + 6_000
p5, p50, p95 = np.percentile(wealth, [5, 50, 95])
print(f"median ${p50:,.0f}; 5th percentile ${p5:,.0f}; 95th percentile ${p95:,.0f}")
print(f"chance of ending below $500,000: {np.mean(wealth < 500_000):.1%}")
print(f"median in today's dollars at 2 % inflation: ${p50 / 1.02**30:,.0f}")median $824,051; 5th percentile $397,409; 95th percentile $1,746,780 chance of ending below $500,000: 13.2% median in today's dollars at 2 % inflation: $454,935
Every step uses tools from the course: utility and risk aversion from lesson 4, the efficient frontier from lesson 5, the CAPM and factor thinking from lessons 6 and 7 to decide that low-cost index exposure is a sensible core, bond duration from lesson 10 to choose the bond fund's maturity, taxes and accounts from lesson 2, risk measures from lesson 3, and fees and performance evaluation from this lesson to monitor the result. The portfolio is not optimal in any precise sense; it is a reasoned, diversified, low-cost plan that Maya understands and can stick with through bad markets, which is often the most important feature of all.
Common mistakes
MistakeA fund with higher past returns is the better choice.
InsteadPast returns say little about future skill; risk, costs and benchmark matter more.
MistakeA 1 % fee difference is too small to matter.
InsteadCompounded over decades, it can cost more than the original investment.
MistakeA positive alpha over three years proves skill.
InsteadShort records are dominated by noise; it can take decades to distinguish skill from luck.
MistakeCIPF protects my portfolio against market declines.
InsteadCIPF protects client property if a member firm fails, not against market losses.
MistakeThe best portfolio is the one with the highest expected return.
InsteadIt must match the investor's risk tolerance, horizon, taxes and ability to stay the course.
Summary and key terms
- Mutual funds price once a day at NAV; ETFs trade all day; closed-end funds and hedge funds differ in structure and regulation.
- Fees compound: a 1–2 % annual difference can cost more than the original investment over 25 years.
- Before costs the average active dollar earns the market return; after costs it must trail, and most active funds have.
- Sharpe, Treynor, Jensen's alpha, the information ratio and M² adjust performance for risk in different ways.
- Survivorship bias, benchmark choice and short records can make performance look better than it is.
- CIRO regulates dealers; CIPF protects up to $1 million per account category if a member firm fails.
- A sound portfolio combines diversification, appropriate risk, tax-aware location, low costs and disciplined rebalancing.
- Net asset value
- The market value of a fund's assets minus liabilities, per unit.
- Exchange-traded fund
- A pooled fund whose units trade on an exchange throughout the day.
- Active management
- Trying to beat a benchmark through security selection or market timing.
- Passive management
- Trying to match a benchmark at low cost, usually by holding an index.
- Treynor ratio
- Excess return divided by beta.
- Jensen's alpha
- The return above that predicted by the CAPM for the portfolio's beta.
- Information ratio
- Alpha divided by tracking error.
- Tracking error
- The standard deviation of the difference between portfolio and benchmark returns.
- Survivorship bias
- The upward bias in performance averages caused by excluding funds that closed or merged.
- Management expense ratio
- The annual cost of a fund, including management and administration, as a percentage of its assets.
Practice problems
Work each problem on paper first, then reveal the answer to check.
$50,000 for 20 years at 7 % before fees, with fees of 1.5 % versus 0.25 %. Ending values?
Show answer
50,000 × 1.055²⁰ = 145,888 versus 50,000 × 1.0675²⁰ = 184,641.
Fund return 10 %, rf 3 %, σ 18 %, β 1.1. Sharpe and Treynor?
Show answer
Sharpe 0.389; Treynor 6.36 %.
Market return 8 %. Jensen's alpha for that fund?
Show answer
10 − (3 + 1.1 × 5) = +1.5 %.
Alpha 1.2 %, tracking error 4 %. Information ratio?
Show answer
0.30.
Fund Sharpe 0.50, market σ 15 %, rf 3 %. M²?
Show answer
3 + 0.50 × 15 = 10.5 %.
Why must the average active dollar trail the market after costs?
Show answer
Before costs active and passive dollars together earn the market; passive earns exactly the market, so active does too, before its higher costs.
What is survivorship bias?
Show answer
Averages that exclude closed or merged funds overstate the returns investors earned.
When is the Treynor ratio more appropriate than the Sharpe ratio?
Show answer
When the fund is one part of a well-diversified portfolio.
What does CIPF cover, and what does it not cover?
Show answer
Client property up to limits if a CIRO member fails; not market losses or crypto assets.
Portfolio task: build a three-fund portfolio for an invented investor, state its expected return, risk, fees and account locations, and explain your rebalancing rule.
Show answer
Answers vary; justify each choice with tools from the course.
Lesson quiz · 5 questions
Score 60% or more to complete this lesson.
Create a free account to save your progress, take quizzes and earn a certificate.