
FIN-301 · Lesson 9 of 12 · 28 min
Fixed income I: bond markets, yields and the term structure
Bond markets are larger than share markets, and their prices, interest rates, affect every other asset. FIN-201 lesson 5 covered the basics from the issuer's point of view: pricing a bond from its yield, finding the yield to maturity, clean and dirty prices, a first look at duration, credit ratings and spot rates. This lesson takes the investor's point of view. It surveys the kinds of fixed-income securities investors hold, explains why the yield to maturity is not the return an investor will actually earn, shows how to extract spot and forward rates from bond prices, and examines what the shape of the yield curve says about expected interest rates, risk premiums and the economy. Lesson 10 then deals with managing interest rate and credit risk.
The fixed-income universe
Fixed-income securities differ by issuer, structure and protection. Government bonds of countries that borrow in their own currency, such as Canada and the United States, carry essentially no default risk in nominal terms and form the benchmark for every other rate. Sub-national bonds, issued by provinces or states and cities, and agency bonds come next. Corporate bonds range from highly rated issues of banks and utilities to high-yield bonds of riskier companies. Securitized products pool mortgages or other loans and pass their cash flows to investors in tranches with different priorities. Structures vary too. Zero-coupon bonds, including government strip bonds created by separating coupons from principal, pay only at maturity. Floating-rate notes reset their coupon to a reference rate plus a spread, so their prices barely move with rates. Inflation-indexed bonds adjust their principal for inflation, so they promise a real rather than a nominal return.
The Government of Canada sells treasury bills and bonds through regular auctions run by the Bank of Canada, to a group of dealers who distribute them. Canadian real return bonds, indexed to the consumer price index, were issued from 1991 until the government stopped new issues in 2022; existing ones still trade. The benchmark reference rate for floating-rate debt and derivatives is now CORRA, the Canadian Overnight Repo Rate Average, which replaced CDOR after June 2024. Most individual Canadians hold bonds through funds, GICs (guaranteed investment certificates issued by banks and protected by deposit insurance within limits) or exchange-traded funds rather than directly.
Yield measures and realized returns
The yield to maturity is a promised yield. It equals the return an investor actually earns only if the bond is held to maturity, every payment is made on time, and every coupon is reinvested at the same yield. If rates fall, coupons are reinvested at lower rates and the realized return falls short; if rates rise, it exceeds the yield. This reinvestment risk is the mirror image of price risk: rising rates hurt a bond's price but help the reinvestment of its coupons. The realized compound yield is the rate that grows the purchase price into the actual ending wealth, including reinvested coupons. Horizon analysis extends the idea to a holding period shorter than maturity: the investor forecasts the bond's price at the horizon, from a forecast of the yield then, plus the value of reinvested coupons.
Worked problem
Realized compound yield
An investor buys a 3-year, 8 % annual-coupon bond at par for $1,000 and holds it to maturity. Coupons are reinvested at 6 % rather than 8 %. What is the realized compound yield?
Show solution
- Coupon 1 grows for two years: 80 × 1.06² = 89.89.
- Coupon 2 grows for one year: 80 × 1.06 = 84.80.
- Final payment: 1,080.
- Ending wealth = 1,254.69; realized yield = (1,254.69 ÷ 1,000)^(1/3) − 1 = 7.86 %.
Answer: Lower reinvestment rates cut the realized return below the 8 % yield to maturity.
For callable bonds, investors compute the yield to call as well as the yield to maturity and focus on the lower of the two, the yield to worst. For bonds with a chance of default, the promised yield overstates the expected return, as FIN-201 lesson 5 noted; the gap is the expected loss from default, which lesson 10 quantifies.
Spot rates and bootstrapping
FIN-201 introduced spot rates: the yields on zero-coupon bonds maturing at each date. They are the fundamental building blocks for pricing any bond, because a coupon bond is simply a package of zero-coupon payments. When strip bonds are not available for every maturity, spot rates can be bootstrapped from coupon bonds. Start with the shortest bond, whose yield is the first spot rate. The next bond's first coupon is discounted at that known spot rate, which leaves one unknown, the second spot rate. Repeat for each longer maturity.
Worked problem
Bootstrapping spot rates
Three annual-coupon bonds with $100 face value trade as follows: 1-year 3 % coupon at 99.50; 2-year 4 % coupon at 100.20; 3-year 5 % coupon at 101.00. Find the spot rates.
Show solution
- 1-year: 103 ÷ 99.50 = 1.03518, so s1 = 3.518 %.
- 2-year: 100.20 = 4 ÷ 1.03518 + 104 ÷ (1 + s2)². The first term is 3.864, so (1 + s2)² = 104 ÷ 96.336; s2 = 3.902 %.
- 3-year: 101.00 = 5 ÷ 1.03518 + 5 ÷ 1.03902² + 105 ÷ (1 + s3)³. The first two terms total 9.462, so (1 + s3)³ = 105 ÷ 91.538; s3 = 4.680 %.
Answer: The spot curve rises from about 3.5 % to 4.7 %. The program below repeats the calculation and finds the forward rates.
# Bootstrapping spot rates from annual-coupon bonds, then implied forward rates
bonds = [(1, 3.0, 99.50), (2, 4.0, 100.20), (3, 5.0, 101.00), (4, 5.0, 100.40), (5, 5.5, 101.30)]
spots = []
for n, cpn, price in bonds:
    pv_known = sum(cpn / (1 + spots[t]) ** (t + 1) for t in range(n - 1))
    s = ((100 + cpn) / (price - pv_known)) ** (1 / n) - 1
    spots.append(s)
for n, s in enumerate(spots, start=1):
    print(f"spot rate, {n} year(s): {s:.3%}")

# One-year forward rate starting in year n-1:  (1+s_n)^n / (1+s_{n-1})^(n-1) - 1
fwd = [spots[0]] + [(1 + spots[n]) ** (n + 1) / (1 + spots[n - 1]) ** n - 1 for n in range(1, len(spots))]
for n, f in enumerate(fwd, start=1):
    print(f"forward rate for year {n}: {f:.3%}")

# Price a new 5-year 4 % bond off the spot curve
price = sum(4 / (1 + spots[t]) ** (t + 1) for t in range(4)) + 104 / (1 + spots[4]) ** 5
print(f"5-year 4 % bond priced off spot curve: {price:.2f}")spot rate, 1 year(s): 3.518% spot rate, 2 year(s): 3.902% spot rate, 3 year(s): 4.680% spot rate, 4 year(s): 4.941% spot rate, 5 year(s): 5.282% forward rate for year 1: 3.518% forward rate for year 2: 4.287% forward rate for year 3: 6.253% forward rate for year 4: 5.728% forward rate for year 5: 6.657% 5-year 4 % bond priced off spot curve: 94.76
Forward rates
Spot rates imply forward rates: the interest rate for a future period that can be locked in today. If the two-year spot rate is 3.9 % and the one-year spot rate is 3.5 %, an investor can earn 3.9 % a year for two years, or 3.5 % for one year and then reinvest. The second-year rate that makes the two strategies equal, about 4.3 %, is the one-year forward rate starting one year from now. Investors can actually lock it in by buying the two-year zero and selling the one-year zero, so forward rates are real market prices, not just arithmetic. They are used to price forward rate agreements and interest rate swaps, and to compare the market's view of future rates with one's own.
Theories of the term structure
Why does the yield curve usually slope upward, and what makes it change shape? The expectations hypothesis says forward rates equal expected future short-term rates, so an upward-sloping curve means the market expects rates to rise and a downward-sloping one that it expects them to fall. Under pure expectations, every strategy over a given horizon has the same expected return. The liquidity preference theory adds that investors demand a premium for holding longer bonds, whose prices are more volatile; forward rates then exceed expected future rates by that term premium, which explains why the curve slopes up most of the time even when rates are not expected to rise. Market segmentation and preferred habitat theories stress the demand of particular investors, such as pension funds and insurers that need long bonds to match long liabilities, and central banks, whose large bond purchases during quantitative easing pushed long yields down. Each theory contains some truth; estimates suggest the term premium varies over time and was close to zero, or even negative, in the late 2010s before rising again.
Reading the yield curve
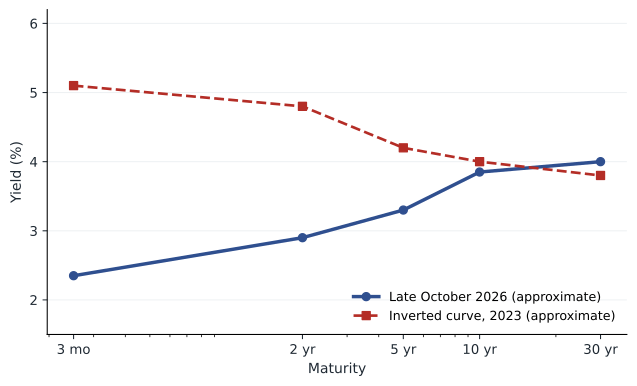
The yield curve is watched as an economic signal. Short rates are anchored by the central bank's policy rate; long rates reflect expected future short rates, expected inflation and the term premium. An inverted curve, with short rates above long rates, has preceded most US recessions since the 1960s, because it typically means the central bank has tightened policy and markets expect it to cut later as growth slows. The signal is not perfect: the curve was deeply inverted in 2022–2024 in both countries, yet neither economy fell into an official recession in that period. The spread between nominal and inflation-indexed bond yields of the same maturity, the breakeven inflation rate, measures the inflation investors expect plus an inflation risk premium.
In late October 2026, approximate Government of Canada yields were about 2.9 % for two years and 3.8 to 3.9 % for ten years, with the Bank of Canada's policy rate at 2.25 %, so the curve sloped upward. These figures are rounded and illustrative; current yields are published daily by the Bank of Canada.
| Curve shape | Typical expectations-based reading | Liquidity premium reading |
|---|---|---|
| Upward sloping | Short rates expected to rise | Normal term premium; rates may be flat |
| Flat | Rates expected to stay level | Rates expected to fall slightly, offset by the premium |
| Inverted | Rates expected to fall, often before a slowdown | Rates expected to fall sharply |
| Humped | Rates expected to rise then fall | Mixed expectations and premiums |
Worked problem
Breakeven inflation
A 10-year Government of Canada bond yields 3.85 % and an existing real return bond of similar maturity yields 1.70 % (illustrative). What inflation rate makes the two equally attractive?
Show solution
- Breakeven ≈ 3.85 − 1.70 = 2.15 % a year.
- Exactly: 1.0385 ÷ 1.0170 − 1 = 2.11 %.
Answer: If inflation averages more than the breakeven, the indexed bond does better; if less, the nominal bond does. The breakeven also includes an inflation risk premium, so it slightly overstates expected inflation.
Common mistakes
MistakeThe yield to maturity is the return an investor will earn.
InsteadOnly if the bond is held to maturity, all payments are made and coupons are reinvested at the same yield.
MistakeRising rates are bad for every bondholder.
InsteadThey lower prices but raise reinvestment income; long-horizon investors can benefit.
MistakeA forward rate is just a forecast.
InsteadIt is a rate that can be locked in today through trades in zero-coupon bonds.
MistakeAn upward-sloping curve proves rates will rise.
InsteadIt may reflect a term premium rather than expected increases.
MistakeAn inverted curve guarantees a recession.
InsteadIt has often preceded recessions, but the 2022–2024 inversion was not followed by an official recession in that period.
Summary and key terms
- Fixed income includes government, sub-national, corporate and securitized debt, with zero-coupon, floating and inflation-indexed structures.
- The yield to maturity is a promised yield; realized returns depend on reinvestment rates and the holding period.
- Spot rates can be bootstrapped from coupon bond prices.
- Forward rates are implied by spot rates and can be locked in today.
- Expectations, liquidity preference and segmentation each explain part of the term structure.
- Inverted curves have often preceded recessions, though not infallibly.
- Breakeven inflation is the nominal yield minus the real yield, adjusted exactly.
- Strip bond
- A zero-coupon bond created by separating the coupons and principal of a government bond.
- Floating-rate note
- A bond whose coupon resets periodically to a reference rate plus a spread.
- Inflation-indexed bond
- A bond whose principal and coupons rise with inflation.
- Reinvestment risk
- The risk that coupons must be reinvested at lower rates.
- Realized compound yield
- The actual return earned, including reinvested coupons, over the holding period.
- Yield to worst
- The lowest of the yield to maturity and the yields to each call date.
- Bootstrapping
- Deriving spot rates step by step from the prices of coupon bonds.
- Forward rate
- An interest rate for a future period implied by today's spot rates.
- Term premium
- The extra return investors demand for holding longer-term bonds.
- Breakeven inflation rate
- The inflation rate at which nominal and inflation-indexed bonds give the same return.
Practice problems
Work each problem on paper first, then reveal the answer to check.
A 2-year, 6 % annual bond bought at par; coupon reinvested at 4 %. Realized yield?
Show answer
Wealth = 60 × 1.04 + 1,060 = 1,122.40; yield = 5.94 %.
s1 = 4 %, s2 = 5 %. One-year forward rate for year 2?
Show answer
1.05² ÷ 1.04 − 1 = 6.01 %.
A 1-year zero sells for 96.15 per 100. Spot rate?
Show answer
100 ÷ 96.15 − 1 = 4.0 %.
Price a 2-year 5 % annual bond if s1 = 4 % and s2 = 4.5 %.
Show answer
4.81 + 96.15 = 100.96.
Under pure expectations, what does a flat curve imply?
Show answer
Short rates are expected to stay where they are.
Why does the curve usually slope upward even when rates are not expected to rise?
Show answer
Investors demand a term premium for holding longer bonds.
Nominal 10-year yield 4.2 %, real yield 1.8 %. Exact breakeven?
Show answer
1.042 ÷ 1.018 − 1 = 2.36 %.
What is the yield to worst of a bond with YTM 6.1 % and yield to call 5.4 %?
Show answer
5.4 %.
Why do floating-rate notes have little interest rate risk?
Show answer
Their coupons reset to market rates, so their price stays near par.
Portfolio task: plot today's Government of Canada yield curve from the Bank of Canada's data and describe its shape.
Show answer
Answers vary; record the date.
Lesson quiz · 5 questions
Score 60% or more to complete this lesson.
Create a free account to save your progress, take quizzes and earn a certificate.