
AERO-220 · Lesson 9 of 12 · 23 min
Take-off performance
The take-off is the most demanding few seconds of most flights. The aircraft is at its heaviest, close to the ground, accelerating from rest through the speeds at which an engine failure would be most dangerous. The airline's request for proposal asks for take-off distances at its bases, including a gravel strip at one community and summer temperatures well above standard, and it asks how the Tern handles a motor failure during the run. This lesson breaks the take-off into its parts, integrates the equation of motion to find the ground roll, adds the airborne distance, and explains the speeds and distances that certification and operating rules use.
The segments of a take-off
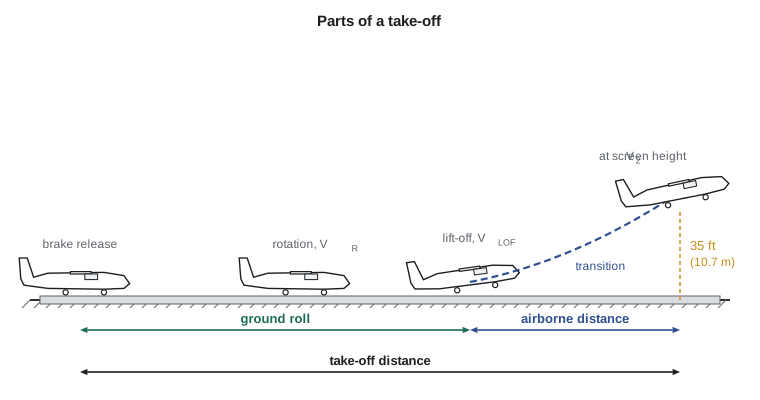
A take-off has two main parts. In the ground roll, the aircraft accelerates along the runway from rest to its rotation speed \(V_R\), at which the pilot raises the nose, and then to its lift-off speed \(V_{LOF}\). In the airborne segment, it rotates into a climb, follows a curved transition arc, and climbs to a screen height: 35 ft for transport-category rules and many commuter procedures, or 50 ft for smaller aircraft. The take-off distance is the total horizontal distance from brake release to the screen height.
The ground roll equation
During the ground roll, four forces act along the runway: thrust forward, and aerodynamic drag, rolling friction and any runway-slope component of weight backward. The friction force is a coefficient \(\mu\) times the load on the wheels, which is the weight minus the lift the wing produces at the attitude the aircraft rolls along. Newton's second law gives the acceleration, and integrating it gives the distance.
Typical rolling friction coefficients are about 0.02 on dry paved runways, 0.04 to 0.05 on firm gravel or short grass, and up to 0.10 or more on soft ground or long grass. The aerodynamic forces use a ground-roll lift coefficient set by the aircraft's attitude on its wheels, and a drag coefficient with take-off flaps and landing gear extended. Because thrust, lift and drag all change with speed, the integral is usually done numerically, by stepping through small time intervals, as the program does.
A useful approximation replaces the varying acceleration with its average, evaluated at about 70 percent of the lift-off speed. Then the ground roll becomes \(s_g \approx V_{LOF}^2/(2\bar{a})\). Since \(V_{LOF}^2\) is proportional to \(W/(\rho S C_{L,max})\), and the average acceleration is roughly proportional to \(T/W\), the ground roll scales approximately with \(W^2/(\rho\,S\,C_{L,max}\,T)\). That one proportionality explains most of take-off performance: heavy aircraft, hot or high airports, small wings, poor flaps and low thrust all lengthen the run, and the effect of weight is roughly squared.
# Take-off: ground roll by numerical integration, air distance to 35 ft, and the balanced field length
import math
g, S, A_prop = 9.81, 28.0, math.pi * 1.4**2          # wing area; disk area of one 2.8 m propeller
def rho_at(h, dT):
    T = 288.15 - 0.0065 * h
    return 101325 * (T / 288.15) ** 5.2559 / (287.05 * (T + dT))
def thrust(V, P, rho, n):                              # n propellers sharing power P
    static = 0.75 * (P / n) ** (2 / 3) * (2 * rho * A_prop) ** (1 / 3) * n
    eta = 0.84 * (1 - math.exp(-V / 30))
    return static if V < 1 else min(static, eta * P / V)
def roll(m, rho, mu, P, n, V_end, V_start=0.0, CD0=0.055, k=0.042, CLg=0.6, dt=0.02):
    W, s, V, t = m * g, 0.0, V_start, 0.0
    while V < V_end:
        q = 0.5 * rho * V**2
        a = (thrust(V, P, rho, n) - q * S * (CD0 + k * CLg**2) - mu * (W - q * S * CLg)) / m
        V += a * dt; s += V * dt; t += dt
    return s, t
def takeoff(m, h=0, dT=0, mu=0.02, label=""):
    rho = rho_at(h, dT)
    Vs = math.sqrt(2 * m * g / (rho * S * 2.1))          # stall speed with take-off flaps (true airspeed)
    V_lof, V2 = 1.15 * Vs, 1.2 * Vs
    s_g, t = roll(m, rho, mu, 900e3, 2, V_lof)
    # airborne segment to 35 ft (10.7 m): climb gradient at V2 with both motors
    q = 0.5 * rho * V2**2; CL = m * g / (q * S)
    grad = (thrust(V2, 900e3, rho, 2) - q * S * (0.040 + 0.042 * CL**2)) / (m * g)
    R = V2**2 / (g * 0.15)                              # pull-up arc at a load factor of 1.15
    gam = math.asin(grad)
    h_arc = R * (1 - math.cos(gam))
    s_air = R * math.sin(gam) + max(0.0, 10.7 - h_arc) / math.tan(gam)   # arc, then straight climb
    print(f"{label:34s} V_LOF {V_lof*3.6:4.0f} km/h  ground roll {s_g:4.0f} m  to 35 ft {s_g + s_air:4.0f} m")
takeoff(6500, label="6500 kg, sea level, ISA, paved")
takeoff(6500, dT=25, label="6500 kg, sea level, ISA+25, paved")
takeoff(6500, h=1600, dT=15, label="6500 kg, 1600 m, ISA+15, paved")
takeoff(6500, mu=0.05, label="6500 kg, sea level, ISA, gravel")
takeoff(5800, mu=0.05, label="5800 kg, sea level, ISA, gravel")
# Balanced field: motor failure at V1, then either stop (2 s to act, braking mu 0.35) or continue on 600 kW
m, rho = 6500.0, rho_at(0, 0)
Vs = math.sqrt(2 * m * g / (rho * S * 2.1)); V_lof = 1.15 * Vs
best = None
for v1_kmh in range(120, int(V_lof * 3.6)):
    V1 = v1_kmh / 3.6
    s1, _ = roll(m, rho, 0.02, 900e3, 2, V1)
    stop = s1 + 2 * V1 + V1**2 / (2 * g * 0.35)            # reaction distance plus braking to rest
    s_go, _ = roll(m, rho, 0.02, 600e3, 1, V_lof, V_start=V1, CD0=0.062)
    go = s1 + s_go + 10.7 / 0.033                         # continue: roll on one motor, then climb to 35 ft at 3.3%
    if best is None or abs(stop - go) < abs(best[1] - best[2]): best = (v1_kmh, stop, go)
print(f"Balanced field: V1 about {best[0]} km/h, accelerate-stop {best[1]:.0f} m, accelerate-go {best[2]:.0f} m")6500 kg, sea level, ISA, paved V_LOF 174 km/h ground roll 607 m to 35 ft 800 m 6500 kg, sea level, ISA+25, paved V_LOF 182 km/h ground roll 677 m to 35 ft 878 m 6500 kg, 1600 m, ISA+15, paved V_LOF 193 km/h ground roll 799 m to 35 ft 1014 m 6500 kg, sea level, ISA, gravel V_LOF 174 km/h ground roll 692 m to 35 ft 885 m 5800 kg, sea level, ISA, gravel V_LOF 165 km/h ground roll 510 m to 35 ft 716 m Balanced field: V1 about 169 km/h, accelerate-stop 972 m, accelerate-go 980 m
What the numbers show
The program covers the airline's cases. At maximum weight on a standard day at sea level on a dry paved runway, the Tern lifts off at 174 km/h after a 607 m ground roll and passes 35 ft at about 800 m. On a day 25 °C hotter than standard, the distance to 35 ft grows by about 10 percent. At a high airport around 1600 m elevation on a warm day, it grows by 27 percent. On gravel, the higher rolling friction adds about 85 m. Reducing the take-off weight to 5800 kg on gravel more than recovers the loss, cutting the distance to 716 m. These are the trade-offs a dispatcher makes every day at short or hot airports.
Electric motors change the hot-day picture. A turboprop engine loses power on a hot day, so its take-off distance grows more than the density change alone would suggest. The Tern's motors do not; only the density effect on lift-off speed, propeller thrust and drag remains. That is one of the selling points Arjun highlights for the airline's summer operations, though he notes that the battery's ability to deliver full power on very hot days depends on its cooling system, which must be demonstrated in testing.
Take-off speeds
Pilots and performance engineers use a family of take-off speeds, each defined by rules and each with a specific job. The stall speed in the take-off configuration sets the scale for the others. Rotation and lift-off speeds must be high enough to give a margin above the stall, and the take-off safety speed \(V_2\), the speed the aircraft should reach by the screen height with one engine failed, is typically at least 1.2 times the stall speed. The minimum control speed \(V_{MC}\) from Lesson 5 sets a floor under them all for multi-engine aircraft.
| Speed | Meaning | Typical relation for the Tern |
|---|---|---|
| V_S | Stall speed in the take-off configuration | 151 km/h at 6500 kg, sea level |
| V_MC | Minimum control speed with the critical motor failed | About 140 km/h |
| V_1 | Decision speed: the last speed at which a stop can begin | About 169 km/h on a balanced field |
| V_R | Rotation speed | About 1.1 V_S |
| V_LOF | Lift-off speed | About 1.15 V_S, 174 km/h |
| V_2 | Take-off safety speed at the screen height | About 1.2 V_S, 182 km/h |
Engine failure and the balanced field
For a multi-engine aircraft, the most critical take-off scenario is an engine or motor failure during the ground roll. If it happens at low speed, the pilot should stop; if it happens at high speed, close to lift-off, there is not enough runway left to stop, and the pilot must continue the take-off on the remaining power. The decision speed \(V_1\) separates the two. Below it, the crew rejects the take-off; at or above it, they continue.
Two distances depend on the speed at which the failure happens. The accelerate-stop distance, to accelerate on all engines to the failure speed, react and brake to a stop, grows as the failure speed rises. The accelerate-go distance, to accelerate to the failure speed and then continue on the remaining engine to the screen height, falls as the failure speed rises, because more of the acceleration happens on full power. The two curves cross at one speed, and the distance there is the balanced field length. Choosing \(V_1\) at that crossing gives the shortest runway that is safe whichever choice the crew must make.
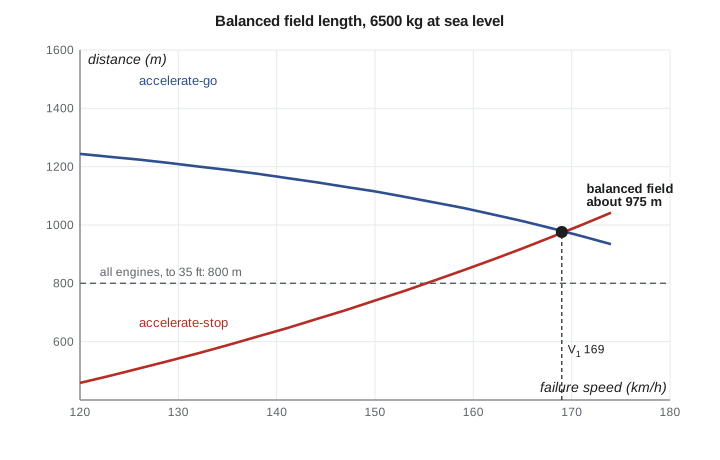
The program estimates a balanced field length of about 975 m for the Tern at maximum weight at sea level, with \(V_1\) near 169 km/h, close to the rotation speed. That is about 22 percent more than the all-engine distance to 35 ft. In the program, the accelerate-go case uses the remaining motor's 600 kW contingency power and the 3.3 percent gradient from Lesson 5, and the accelerate-stop case assumes the pilot takes 2 seconds to recognize the failure and act, then brakes with a deceleration of about 0.35 g. Certification rules specify these assumptions in detail, including how much reaction time to allow and whether reverse thrust may be counted, and the flight manual's numbers come from flight tests flown to those rules.
Worked problem
Scaling the ground roll for a heavier aircraft
An operator asks what would happen to the ground roll if a future version of the Tern had a maximum take-off weight of 7000 kg with the same wing, flaps and power. Use the approximate scaling \(s_g \propto W^2\) at constant thrust, starting from 607 m at 6500 kg, and check the lift-off speed.
Show solution
- Weight ratio: \(7000/6500 = 1.077\).
- Ground roll: \(607 \times 1.077^2 = 704\ \text{m}\), about 16 percent longer.
- Lift-off speed: \(174 \times \sqrt{1.077} = 181\ \text{km/h}\).
- The balanced field length would grow by a similar proportion, to roughly 1130 m.
Answer: An 8 percent heavier aircraft needs about 16 percent more runway. That is why aircraft that grow over their service lives often need larger flaps or more power to keep their field performance, and why operators at short strips care so much about every kilogram of empty weight.
Corrections for real conditions
Flight manual take-off charts start from standard conditions and apply corrections. Headwind shortens the take-off because the aircraft needs less ground speed to reach its lift-off airspeed; manuals usually take credit for only half the reported headwind, as a safety margin, and apply 150 percent of any tailwind. An uphill slope lengthens the roll, roughly by the distance needed to climb the slope's height in energy terms. Wet runways reduce braking for the accelerate-stop case. Runways contaminated with standing water, slush or snow add drag from the contaminant spray and reduce braking still further, and take-off may be prohibited above certain depths.
Runway condition reporting was overhauled in the last decade to give crews more consistent information. The United States introduced the Takeoff and Landing Performance Assessment, with a runway condition assessment matrix and runway condition codes, on October 1, 2016, and Canada moved to the closely related ICAO Global Reporting Format in 2021. Both give pilots a numerical code for each third of the runway, linked to the braking they can expect, which feeds directly into performance calculations.
Regulatory distances and margins
Certification establishes the aircraft's capability; operating rules then add margins. For large transport aircraft, the required take-off distance includes a 15 percent margin over the all-engine distance, and the runway must also accommodate the accelerate-stop and one-engine-out cases. For commuter aircraft, the details depend on the aircraft's certification basis and the type of commercial operation, set out in Canadian Aviation Regulations. The principle is the same everywhere: the runway available must exceed the most demanding of the distances the rules require, with margins for the variability of real pilots, real aircraft and real weather.
Common mistakes
MistakeAssuming a 10 percent weight increase adds 10 percent to the take-off run.
InsteadGround roll scales roughly with W², so 10 percent more weight adds about 21 percent.
MistakeTaking full credit for a reported headwind.
InsteadPerformance charts typically use only half the headwind and 150 percent of the tailwind.
MistakeTreating V1 as the speed at which the aircraft can always stop.
InsteadV1 is the decision speed; a rejected take-off must begin no later than V1 to stop within the planned distance.
MistakeIgnoring rolling friction differences between paved and gravel runways.
InsteadFriction coefficients of 0.04 to 0.05 on gravel add noticeably to the ground roll.
MistakeAssuming electric aircraft are unaffected by hot days.
InsteadMotor power is unaffected, but lower density still raises lift-off speed and reduces propeller thrust.
Summary and key terms
- Take-off distance is the ground roll to lift-off plus the airborne distance to a 35 ft or 50 ft screen height.
- The ground roll comes from integrating m dV/dt = T − D − μ(W − L) − W sin φ.
- Approximately, ground roll scales with W²/(ρ S C_L,max T).
- V1, V_R, V_LOF and V2 are defined relative to the stall speed and V_MC.
- The balanced field length is where accelerate-stop and accelerate-go distances are equal.
- Wind, slope, temperature, altitude and runway condition all require corrections, with safety factors.
- Ground roll
- The distance from brake release to lift-off.
- Screen height
- The height at the end of the take-off distance: 35 ft or 50 ft depending on the rules.
- Rotation speed
- V_R, the speed at which the pilot raises the nose to begin lift-off.
- Decision speed
- V1, the highest speed at which a rejected take-off may begin.
- Take-off safety speed
- V2, the speed to be reached by the screen height with one engine inoperative.
- Accelerate-stop distance
- The distance to accelerate to the failure speed and then stop.
- Accelerate-go distance
- The distance to accelerate to the failure speed and continue to the screen height on the remaining power.
- Balanced field length
- The runway length at which accelerate-stop and accelerate-go distances are equal.
Practice problems
Work each problem on paper first, then reveal the answer to check.
An aircraft accelerates at an average of 2.5 m/s² to a lift-off speed of 50 m/s. Estimate its ground roll.
Show answer
s = 50²/(2 × 2.5) = 500 m.
By what factor does the ground roll change at an airport where σ = 0.85, other things equal?
Show answer
Roughly 1/0.85 = 1.18, about 18 percent longer, before any loss of thrust.
A take-off chart gives 700 m in still air. The reported headwind is 20 km/h and the lift-off speed 170 km/h. Using half the headwind, estimate the new ground roll.
Show answer
Ground speed at lift-off is 160 km/h; distance scales with ground speed squared: 700 × (160/170)² = 620 m.
Why does the accelerate-stop distance increase with the failure speed?
Show answer
The aircraft has accelerated further and must dissipate more kinetic energy, which grows with speed squared.
Why must V1 be no greater than V_R?
Show answer
The decision to stop or go must be made while the aircraft is still on the ground under full control.
In the program, set the friction coefficient to 0.08 for soft grass at 6500 kg. What is the ground roll?
Show answer
About 805 m on the ground, and about 1000 m to 35 ft.
Lesson quiz · 5 questions
Score 60% or more to complete this lesson.
Create a free account to save your progress, take quizzes and earn a certificate.