
PWR-510 · Lesson 8 of 12 · 22 min
Failure analysis and root cause
▶ Video coming soon A video version of this lesson is on the way.
During Keswold's fall outage, Ingeborg's flow-accelerated corrosion scan found an elbow on the economizer recirculation line that had thinned from its nominal 0.237 in to 0.161 in, close to its minimum required thickness of 0.126 in. The elbow was cut out and replaced with a 1¼ chromium-½ molybdenum fitting before the unit restarted. Ingeborg had kept the old elbow, sectioned it and sent the pieces to a laboratory, and the report had just come back. She brought it to the session, along with Grazyna's investigation of the boiler 3 pitting at Cantwell (PWR-340). "Two failures that didn't happen," she said. "Both found in time. The point of studying them is to make sure the next one is found in time too."
A chief engineer is responsible for making sure that failures and near failures are investigated, that their physical causes are understood, that the root causes in the plant's systems are found, and that corrective actions are carried out and checked. This lesson describes the main failure mechanisms of boiler and power plant components, the steps of a failure analysis, the use of the Larson-Miller parameter for creep, lessons from serious flow-accelerated corrosion failures, and the methods of root cause analysis that turn a broken part into an improved system.
How metal parts fail
Each failure mechanism leaves its own signature on the part, and recognizing it is the first step of an analysis (PWR-340).
- Ductile overload: the part was loaded beyond its strength; the fracture shows thinning, necking and a dull, fibrous surface.
- Brittle fracture: sudden fracture with little deformation, often at low temperature or in embrittled material; the surface is flat and bright, with chevron marks pointing to the origin.
- Fatigue: a crack starts at a stress concentration and grows a little with each cycle; the surface shows smooth bands, called beach marks, around the origin and a final rough zone where the remaining section broke.
- Creep: at high temperature the metal slowly deforms under stress, forming voids at grain boundaries that link into cracks; tubes bulge and fail with a thick-edged fish-mouth rupture after long service.
- Short-term overheating: a tube that loses cooling, from low water or blocked flow, yields quickly at very high temperature and bursts with a thin, knife-edged rupture.
- Corrosion and erosion: metal loss by general corrosion, pitting, flow-accelerated corrosion or erosion until the wall can no longer carry the load.
- Hydrogen damage: under deposits in boiler tubes, concentrated acidic contaminants produce atomic hydrogen that diffuses into the steel, reacts with its carbon and creates microcracks; the tube fails with a thick-edged, window-like rupture, often with little wall loss.
- Caustic gouging and stress corrosion cracking: concentrated chemicals attack the metal, either by dissolving it under deposits or by cracking it under tensile stress.
Many failures involve more than one mechanism. A tube thinned by corrosion may fail by overload; a crack started by corrosion may grow by fatigue. The analysis aims to establish the sequence: what started the damage, what made it grow, and what finally caused the part to fail.
The steps of a failure analysis
- Make safe and preserve the evidence: photograph the failure in place, protect fracture surfaces from handling and corrosion, keep deposits, and record operating data before the historian overwrites it.
- Collect the history: design, materials, operating conditions, chemistry, previous inspections and repairs, and what happened in the hours and days before.
- Examine the part: visual and low-magnification examination, measurements of wall thickness and swelling, nondestructive testing of neighboring parts.
- Laboratory work: sectioning, metallography to see the microstructure, chemical analysis of the metal and deposits, hardness and mechanical tests, and scanning electron microscopy of fracture surfaces.
- Form and test hypotheses: each possible mechanism is checked against all the evidence, and those that do not fit are rejected.
- Report the mechanism, its causes and recommendations, with the evidence that supports them.
The laboratory report on Keswold's elbow found a scalloped, "orange peel" internal surface with a thin, black magnetite layer, no deposits and no cracking, and a steel with very low chromium content. Those are the signatures of single-phase flow-accelerated corrosion. The wear was greatest on the outer radius of the elbow, just downstream of a control valve, where turbulence was highest.
Flow-accelerated corrosion
In flow-accelerated corrosion (FAC), the protective magnetite film on carbon steel dissolves into flowing water or wet steam faster than it can re-form, so the wall thins steadily, sometimes by a millimeter or more a year. FAC is worst in carbon steel with very little chromium, in water at about 250 to 430 °F, at high velocity and turbulence such as elbows, tees, reducers and downstream of valves and orifices, at a pH that is too low, and under reducing, low-oxygen chemistry. It is controlled by chemistry, such as raising the pH and, in all-ferrous systems, using oxidizing all-volatile treatment as Keswold does (PWR-330); by materials, since even small amounts of chromium greatly reduce FAC; and by inspection of the susceptible locations.
Worked problem
How long did the elbow have?
The elbow had been in service for six years since commissioning. It thinned from 0.237 in to 0.161 in, and its minimum required thickness was 0.126 in. Assuming the rate was steady, how long would it have lasted from the outage?
Show solution
- \[r = \frac{0.237 - 0.161}{6} = 0.0127 \text{ in/yr} \qquad RL = \frac{0.161 - 0.126}{0.0127} = 2.8 \text{ yr}\]
Answer: Less than three years, and less than the four years until the next major outage. Without the scan, the elbow would have been expected to reach its minimum during operation and could have ruptured releasing hot water that flashes to steam. Ingeborg's corrective actions extended beyond the elbow: every similar location in the HRSG's feedwater and drain systems was added to the FAC scanning program, the remaining carbon steel fittings downstream of control valves were scheduled for replacement with chromium-containing steel, and the chemistry program's pH limits were reviewed with the water treatment supplier.
Two serious accidents made FAC a priority for every steam plant. In 1986, an elbow in a feedwater pump suction line at the Surry nuclear station in Virginia ruptured, killing four workers; the pipe had thinned by FAC and had not been included in an inspection program. In 2004, a condensate line at the Mihama nuclear station in Japan ruptured, killing five workers and injuring six; the section had been left off the inspection list and had never been examined. Both happened in the non-nuclear, conventional part of the plant, and both taught the same lesson: a FAC program must cover every susceptible location, which means it needs a complete, current list of lines and fittings, not just the ones someone remembered.
Creep and the Larson-Miller parameter
Creep life depends very strongly on temperature. A common way to compare life at different temperatures and stresses is the Larson-Miller parameter, which combines absolute temperature and time to rupture at a given stress. For many steels the constant C is taken as about 20 when time is in hours (typical). At the same stress, the same LMP means the same damage, so the relation can estimate how much life is lost when a tube runs hotter than its design.
Worked problem
The cost of running hot
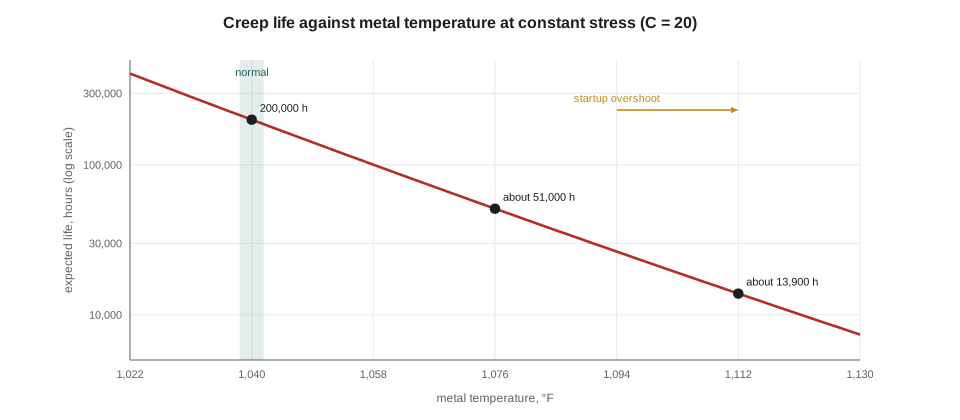
A superheater tube is expected to last about 200,000 hours at a metal temperature of 1,040 °F at its operating stress. Using C = 20, estimate its life at the same stress if it ran at 1,076 °F, and at 1,112 °F.
Show solution
- \[LMP = 1{,}499.67 \times (20 + \log_{10} 200{,}000) = 1{,}499.67 \times 25.301 = 37{,}943\]
- \[\text{At } 1{,}535.67 \text{ °R: } \log_{10} t_r = \frac{37{,}943}{1{,}535.67} - 20 = 4.708 \qquad t_r \approx 51{,}000 \text{ h}\]
- \[\text{At } 1{,}571.67 \text{ °R: } \log_{10} t_r = \frac{37{,}943}{1{,}571.67} - 20 = 4.142 \qquad t_r \approx 13{,}900 \text{ h}\]
Answer: Running 36 °F hotter cuts the expected life from about 200,000 hours to about 51,000, and running 72 °F hotter cuts it to about 13,900, less than two years of continuous service. Three months at 1,112 °F would use up about 16 in 100 of the tube's life. That is why superheater outlet temperatures are controlled closely, why overshoots during startup matter, and why tubes with internal oxide scale, which insulates them and raises their metal temperature, are monitored and eventually replaced.
Life assessment of creep-range components uses more than the LMP. Inspectors measure tube diameters for swelling, oxide scale thickness by ultrasonics, and hardness; replication takes a plastic impression of a polished surface to show creep voids in the microstructure; and samples can be cut for accelerated rupture tests. The results feed a remaining life estimate and a plan for replacement before failure.
From physical cause to root cause
A failure analysis finds the physical cause: what happened to the metal. A root cause analysis (RCA) asks why the plant's systems allowed it: why the condition existed, why it was not detected, and why it was not corrected. Root causes are usually found in management systems: procedures, training, design, inspection programs, communication, supervision and resources. Fixing only the physical cause, replacing the elbow, leaves the next elbow to fail. Fixing the root cause, the incomplete FAC program, protects all of them.
Several structured methods help an investigation team avoid stopping at the first explanation.
- Five whys: ask why the event happened, then why that happened, and so on, until a cause is reached that the organization can change. Simple, but it can follow a single line and miss others.
- Fishbone (Ishikawa) diagram: list possible causes under headings such as people, procedures, equipment, materials, environment and management, so that no category is overlooked.
- Cause and effect charting or cause mapping: lay out the events and conditions in time order and link each to its causes, with evidence for each link.
- Fault tree analysis: work down from the top event through logic gates to the combinations of failures that could cause it, useful for complex systems.
- Barrier analysis: identify the barriers that should have prevented the event, such as a procedure, an alarm, an inspection or a design feature, and why each failed or was missing.
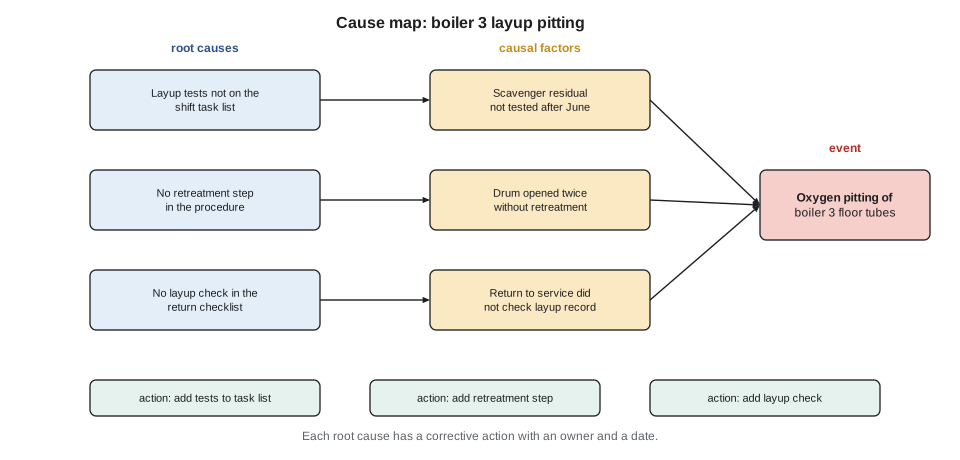
Grazyna's investigation of the boiler 3 pitting used a cause map (PWR-340). The physical cause was oxygen pitting during a summer wet layup. The causal factors were that the sulfite residual was not tested after June, that the drum was opened twice without retreatment, and that the return to service in September did not check the layup record or examine the floor tubes closely for pitting. The root causes were that the layup tests were never put on the shift task list when routine tests moved onto it, that the layup procedure had no retreatment step after opening, and that the return-to-service checklist had no layup check.
Corrective actions that work
Corrective actions should address each root cause, be specific, have an owner and a due date, and be checked for effectiveness after they are done. Actions follow a hierarchy similar to the hierarchy of hazard controls: eliminating a hazard or changing a design is stronger than adding a procedure, which is stronger than retraining people or telling them to be careful. "Retrain the operator" is rarely enough by itself; if a capable, trained person made the error, the system made the error easy.
A good investigation also looks for extent of condition: where else could the same cause produce the same problem? Keswold's elbow led to a review of every similar fitting. Cantwell's layup pitting led to a review of all seasonal procedures, not only the layup procedure. And a chief engineer looks across investigations for patterns, such as several events with weak handovers or several with missing procedure steps, that point to a deeper weakness.
Investigations should also look at what went right. The scan that found Keswold's elbow was the result of a program that Ingeborg had built against some resistance, and the water balance that let Desmond find boiler 3's tube leak at Cantwell was a habit Grazyna had taught (PWR-220). Reinforcing what works is as important as fixing what failed.
Common mistakes
MistakeDiscarding the failed part before it has been examined.
InsteadPreserve the part, its fracture surfaces and deposits, and record the operating data.
MistakeStopping at the physical cause.
InsteadAsk why the system allowed the condition, failed to detect it and failed to correct it.
MistakeWriting "retrain the operator" as the only corrective action.
InsteadChange the design, procedure or system that made the error likely, and check effectiveness.
MistakeInspecting only the FAC locations someone remembers.
InsteadKeep a complete, current list of susceptible lines and fittings.
MistakeIgnoring short temperature overshoots in creep-range tubes.
InsteadTrack metal temperature excursions; creep life falls steeply with temperature.
MistakeFixing the one failed part without checking the extent of condition.
InsteadLook for the same cause elsewhere in the plant.
Summary and key terms
- Each failure mechanism, from overload, brittle fracture and fatigue to creep, overheating, corrosion and hydrogen damage, leaves a recognizable signature.
- A failure analysis preserves evidence, collects history, examines the part, uses laboratory work and tests hypotheses against all the evidence.
- FAC thins carbon steel in flowing water at intermediate temperatures; it is controlled by chemistry, chromium-containing materials and complete inspection programs, as the Surry and Mihama accidents showed.
- The Larson-Miller parameter shows that creep life falls steeply with temperature; a few tens of degrees can cut life severalfold.
- Root cause analysis looks beyond the physical cause to the management system weaknesses that allowed it, using methods such as five whys, fishbone diagrams, cause maps, fault trees and barrier analysis.
- Corrective actions follow a hierarchy, address extent of condition, have owners and dates, and are checked for effectiveness.
- Beach marks
- Bands on a fatigue fracture surface that mark the progress of the crack.
- Fish-mouth rupture
- A thick-edged, gaping tube failure typical of long-term creep.
- Hydrogen damage
- Cracking and decarburization of steel by hydrogen formed under deposits.
- Flow-accelerated corrosion
- Thinning of carbon steel by dissolution of its oxide film into flowing water or wet steam.
- Larson-Miller parameter
- A combination of absolute temperature and rupture time used to compare creep life.
- Replication
- A plastic impression of a polished surface used to examine microstructure in place.
- Root cause
- A fundamental cause in a management system that, if corrected, prevents recurrence.
- Extent of condition
- The other places where the same cause could produce the same problem.
Practice problems
Work each problem on paper first, then reveal the answer to check.
A pipe thinned from 0.315 to 0.256 in in 5 years; minimum 0.197 in. Remaining life?
Show answer
About 5 years.
LMP of a tube at 1,022 °F for 100,000 h with C = 20 (in °R)?
Show answer
About 37,040.
A thin, knife-edged burst suggests which mechanism?
Show answer
Short-term overheating.
Name two root cause methods that help avoid stopping at one explanation.
Show answer
Fishbone diagrams and cause maps (also fault trees or barrier analysis).
Lesson quiz · 5 questions
Score 60% or more to complete this lesson.
Create a free account to save your progress, take quizzes and earn a certificate.