
PWR-510 · Lesson 10 of 12 · 25 min
Sustainability and decarbonization of plants
▶ Video coming soon A video version of this lesson is on the way.
Marrowby Foods had published a target to cut the greenhouse gas emissions from its operations, including the steam it buys, and its sustainability manager had asked Keswold what it could offer. Keswold's owner had its own targets, and the rules on emissions from power generation were changing on both sides of the border. Morwenna asked Anselm to prepare a short briefing on Keswold's options. "Twenty years from now, the chief engineer of this plant will spend as much time on carbon as on steam," she said. "Start learning it now."
This lesson covers how to measure a plant's emissions, how to allocate them between power and heat, the order in which reduction options are usually considered, the main technologies (efficiency, lower-carbon fuels, hydrogen, electrification, carbon capture and storage, and storage of heat), the policies that affect a cogeneration plant in 2026, and the wider sustainability issues of water, air quality and waste. It closes with how a chief engineer builds a decarbonization plan that is honest about cost and uncertainty.
Measuring the footprint
A plant's direct greenhouse gas emissions, its scope 1 emissions, come mostly from burning fuel. For natural gas, carbon dioxide is calculated from the fuel's heat content and an emission factor, with smaller contributions from methane and nitrous oxide from combustion and from any leaks. Scope 2 emissions come from purchased electricity and steam; Marrowby's purchased steam from Keswold is part of Marrowby's scope 2, and Keswold's emissions are what Marrowby's sustainability manager wants to see fall.
Worked problem
Keswold's annual emissions
Keswold generates about 429,000 MWh net a year (an average of about 55 MW over 7,800 hours), at a net heat rate of about 8,734 Btu/kWh on a higher heating value basis (PWR-410). Using an emission factor of 53.06 kg of CO₂ per MMBtu of natural gas (EPA's default factor), estimate the plant's annual CO₂ emissions and its emissions per MWh of electricity if all of them are charged to electricity.
Show solution
- \[\text{Fuel} = 429{,}000 \times 8.734 = 3.75 \times 10^6 \text{ MMBtu}\]
- \[CO_2 = 3.75 \times 10^6 \times 53.06 \text{ kg} \approx 199{,}000 \text{ t} \qquad \frac{199{,}000}{429{,}000} = 0.464 \text{ t/MWh}\]
Answer: About 199,000 metric tons of CO₂ a year, or 0.464 t per MWh if the steam is ignored. That is less than a coal plant, which emits roughly twice as much per MWh, but far more than the near-zero electricity that most decarbonization plans call for by mid-century. The figure is also unfair to Keswold, because the plant produces steam as well as power, and part of its emissions belong to the steam.
Allocating emissions between electricity and heat in a cogeneration plant can be done in several ways. The energy method shares them in proportion to the energy delivered; the efficiency method shares them in proportion to the fuel that separate production would have needed, using reference efficiencies for a boiler and a power plant; and some programs use a fixed credit for the heat. Each gives a different answer, and a report must say which it uses. If the steam is credited with the fuel a separate boiler would have burned, as in the fuel chargeable to power calculation of PWR-410, the steam's footprint equals that of boiler steam and the whole benefit of cogeneration appears on the power side; other methods share the benefit between the two. Whether cogeneration saves fuel at all depends on what it is compared with: against an older fossil plant and a separate boiler it saves a good deal, against a modern combined cycle plant and a separate boiler the saving is small or nil.
The order of options
Decarbonization options are usually considered in an order that starts with the cheapest and most certain and ends with the most expensive and least proven.
- Use less: improve efficiency, reduce auxiliary loads, return more condensate, fix steam traps and insulation, and help the customer use less steam.
- Use cleaner fuel: renewable natural gas, hydrogen blends and, where available, biomass, each with its own supply, cost and emissions accounting.
- Electrify: replace combustion with electric boilers or heat pumps where the grid is clean and the price is acceptable.
- Capture: capture CO₂ from the stack and store it permanently, where storage and the economics allow.
- Offset: buy credits for reductions elsewhere, for the emissions that remain, under the rules of the program that applies.
The order is a guide, not a rule: a plant may combine options, and the right mix depends on the grid, fuel prices, policy and the plant's remaining life.
Efficiency first
Every unit of fuel not burned is CO₂ not emitted, at a profit. At Keswold, Ingeborg's list included the gas turbine's offline washes and inlet filter changes, which recover output and heat rate (PWR-410); the duct burner and attemperator controls; the cooling tower and condenser performance; the efficiency of large pumps and fans (lesson 6); steam traps, insulation and condensate return at Marrowby; and the auxiliary load. These measures rarely cut emissions by more than a few in 100 in a modern plant, but they pay for themselves and should be done first.
Lower-carbon fuels and hydrogen
Renewable natural gas (RNG), made from landfill gas, wastewater treatment or agricultural digesters and cleaned to pipeline quality, can be burned in existing equipment without change. Its supply is limited and its price higher than fossil gas, and the emission reduction depends on how the program that applies counts it. Buying RNG through the pipeline, without physically receiving the molecules, is accepted by some programs and not others.
Hydrogen burns without producing CO₂, but it is very different from natural gas. It has about a third of the heating value of natural gas per unit volume, burns faster and hotter, and can cause flashback in lean premixed burners, raise NOx, and embrittle some steels. Gas turbine manufacturers are developing combustors for high hydrogen blends, and many existing dry low-NOx combustors can accept only modest blends without modification (typical; each machine needs its manufacturer's assessment). Hydrogen also needs a supply: low-carbon hydrogen is made by electrolysis with clean electricity or from natural gas with carbon capture, and both are expensive and not yet widely available.
Worked problem
What does a 20 in 100 hydrogen blend achieve?
Natural gas has a higher heating value of about 1,030 Btu/ft³ (PWR-210) and hydrogen about 343 Btu/ft³. If Keswold blended 20 in 100 hydrogen by volume into its fuel, what fraction of the fuel energy would come from hydrogen, and roughly how much CO₂ would be avoided each year?
Show solution
- \[f = \frac{0.2 \times 343}{0.2 \times 343 + 0.8 \times 1{,}030} = \frac{68.6}{892.6} = 0.077\]
- \[\Delta CO_2 \approx 0.077 \times 199{,}000 \approx 15{,}300 \text{ t/yr}\]
Answer: A blend of 20 in 100 by volume supplies only about 8 in 100 of the energy, and cuts CO₂ by about the same fraction, because hydrogen carries so little energy per cubic meter. Large reductions need blends well above half, which means new combustors, new fuel systems and a large supply of low-carbon hydrogen. Hydrogen is a long-term option for Keswold, worth watching and planning for, rather than a near-term one.
Electrification
An electric boiler turns electricity into steam at nearly 100 in 100 efficiency, with no stack. Electrode boilers pass current through the boiler water itself and reach large sizes at medium voltage; resistance boilers use immersed elements and suit smaller duties. Industrial heat pumps can deliver heat at two to four times the electricity they use, but today's commercial units reach only about 300 to 390 °F (typical), enough for hot water and low-pressure steam but not for Marrowby's 175 psia steam without further compression. Whether electrification reduces emissions depends entirely on the grid, and whether it is affordable depends on the price of electricity compared with gas.
Worked problem
Is electric steam cleaner?
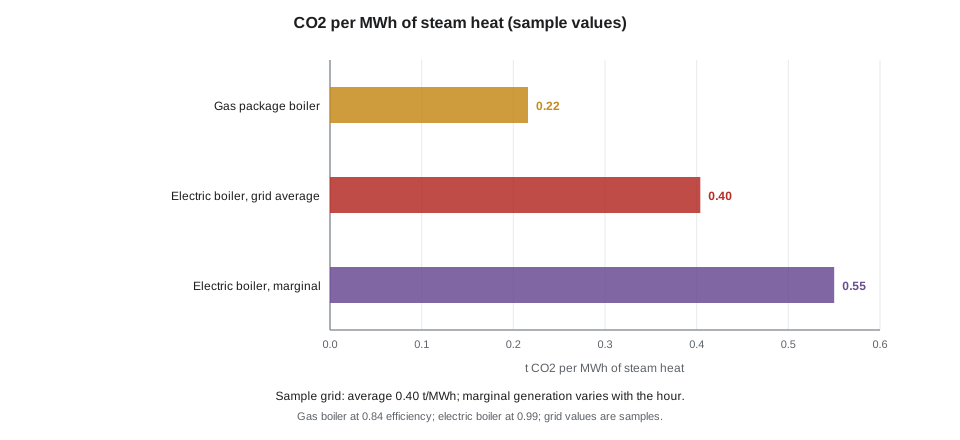
Compare the CO₂ emitted per MWh of steam heat from a gas package boiler at 0.84 efficiency (HHV) with an electric boiler at 0.99 efficiency, if the grid's average emissions are 0.40 t/MWh (a sample figure, of the order of recent averages in Ohio's region).
Show solution
- \[\text{Gas: } \frac{3.412 \text{ MMBtu}}{0.84} \times 53.06 \text{ kg/MMBtu} = 0.216 \text{ t/MWh}_{th}\]
- \[\text{Electric: } \frac{0.40}{0.99} = 0.404 \text{ t/MWh}_{th}\]
Answer: On a grid with the sample average, electric steam emits nearly twice as much CO₂ as gas steam, so electrifying Marrowby's steam today would increase emissions. As the grid adds renewables and retires coal, the balance will shift, and the analysis should use the marginal emissions of the generation that actually responds to the extra load, as well as the average. The cost side matters too: at a sample industrial price of 0.11 dollars per kWh, electric steam costs several times as much as gas steam, as lesson 12 will show.
Electrification also changes the plant's electrical system. A large electric boiler needs a medium voltage supply and may need a new transformer and a utility service upgrade, with long lead times. Combined with thermal storage, such as steam accumulators or hot water tanks, electric boilers can run when electricity is cheapest and cleanest and store the heat for later, which can improve both cost and emissions.
Carbon capture and storage
Carbon capture and storage (CCS) separates CO₂ from flue gas, usually with an amine solvent that absorbs CO₂ in one column and releases it when heated in another, compresses it, and sends it by pipeline to permanent storage in deep rock formations. Gas turbine exhaust is dilute, with only a few in 100 CO₂ by volume (typical), so the capture plant is large and its steam and power demand cuts the plant's output noticeably. CCS needs suitable storage geology within pipeline reach, a legal framework for long-term storage liability, and a business case supported by policy, such as carbon prices, regulations or tax credits. For a single 60 MW plant without a nearby storage hub, CCS is rarely practical today; for large plants in regions with storage and policy support, it is being built.
Policy in 2026
Federal policy on power plant greenhouse gases changed sharply in 2026. In September 2026 EPA published a final rule repealing most of its 2024 carbon pollution standards for power plants, including the guidelines for existing gas- and oil-fired steam units and the carbon capture-based standards for new base load combustion turbines, while keeping the efficiency-based standards for new and reconstructed turbines and the 2015 standards; the repeal takes effect in mid-November 2026. At the same time EPA proposed to eliminate all remaining greenhouse gas standards for power plants, with comments due in early November, and the reporting program's future was also uncertain (PWR-420). Ohio has no state carbon price. The rules may change again, and legal challenges are likely, so a chief engineer's plan must not depend on any one of them. Customers' targets, such as Marrowby's, and investors' expectations continue to drive the owner's decisions regardless.
A chief engineer need not be a policy expert, but must know which rules apply to the plant, when they take effect, what they cost, and what is likely to change, and must report that clearly to the owner. Morwenna's briefing note for the owner has a short table of rules, dates and status, updated each quarter.
Beyond carbon
Sustainability is wider than greenhouse gases. A cogeneration plant also affects air quality, through NOx and, to a lesser extent, carbon monoxide and particulate matter, controlled by dry low-NOx combustors and, in some plants, selective catalytic reduction (PWR-330); water, through cooling tower makeup and blowdown, which at Keswold reaches about 279 gpm of makeup at full load (PWR-420); waste, including spent resins, filters, oily water and used oil; noise for the neighbors; and land and community. Many owners report on these together, and customers like Marrowby ask about them in their supplier audits.
Some options affect several of these at once. Electrification removes stack emissions and cooling tower water use for that steam, but may increase emissions elsewhere if the grid is not clean. Carbon capture uses large amounts of cooling water and steam. Hydrogen can raise NOx. A good plan looks at all of these effects, not only at CO₂.
Building an honest plan
Anselm's briefing for Marrowby, reviewed by Morwenna, followed a simple structure that she recommended for any decarbonization plan.
- Baseline: today's emissions, measured and allocated by a stated method.
- Options: each option's reduction, cost per metric ton avoided, readiness, risks and effect on reliability, air, water and waste.
- Sequence: what can be done now, what depends on technology, prices or policy, and the trigger that would start each later step.
- Uncertainty: ranges for costs and reductions, and the assumptions behind them, including grid emissions and policy.
- Commitments: only what the plant is confident it can deliver, with dates and measures.
For Keswold, the near-term commitments were efficiency measures and a study of renewable natural gas supply; hydrogen readiness would be built into the specifications of any new equipment; and electrification of part of Marrowby's growth would be revisited if electricity prices and grid emissions moved in its favor, which lesson 12 explores. "Never promise a customer a technology you can't buy," Morwenna said. "Promise them what you'll do, and show them the numbers that decide the rest."
Common mistakes
MistakeCharging all of a cogeneration plant's emissions to its electricity.
InsteadAllocate emissions between power and heat by a stated method.
MistakeAssuming electrification always reduces emissions.
InsteadCompare with the grid's average and marginal emissions where the plant is.
MistakeExpecting a small hydrogen blend to cut CO₂ in proportion to its volume.
InsteadCalculate the energy fraction; 20 in 100 by volume gives about 8 in 100 of the energy.
MistakeBuilding a plan on one policy that may change.
InsteadTrack rules, dates and status, and plan for a range of outcomes.
MistakeLooking only at CO₂.
InsteadAssess effects on NOx, water, waste, noise and reliability too.
MistakeCommitting to unproven technology.
InsteadCommit to what can be delivered and set triggers for later steps.
Summary and key terms
- A gas-fired plant's scope 1 emissions come mostly from fuel; Keswold emits about 199,000 t of CO₂ a year, 0.464 t/MWh if all is charged to power.
- Cogeneration emissions are allocated between power and heat by stated methods; cogeneration steam has a lower footprint than separate boiler steam.
- Options are usually considered in the order use less, cleaner fuel, electrify, capture and offset.
- Hydrogen has low volumetric heating value; a 20 in 100 volume blend gives only about 8 in 100 of the energy.
- Electrification's benefit depends on grid emissions, average and marginal, and its cost on the electricity price; CCS needs storage, scale and policy support.
- Policies in 2026 were changing in both countries; an honest plan has a baseline, costed options, a sequence with triggers, ranges and achievable commitments.
- Scope 1 emissions
- Direct emissions from sources the organization owns or controls.
- Scope 2 emissions
- Emissions from purchased electricity, steam, heat or cooling.
- Emission factor
- The mass of a pollutant emitted per unit of fuel energy or activity.
- Renewable natural gas
- Biomethane cleaned to pipeline quality.
- Electrode boiler
- An electric boiler that passes current through the boiler water.
- Marginal emissions
- The emissions of the generation that responds to a change in load.
- Carbon capture and storage
- Separating CO₂ from flue gas and storing it permanently underground.
- Output-based pricing
- A carbon pricing system that charges for emissions above a performance standard per unit of output.
Practice problems
Work each problem on paper first, then reveal the answer to check.
CO₂ from 1,000,000 MMBtu of gas at 53.06 kg/MMBtu?
Show answer
53,060 metric tons.
Energy fraction of a 10 in 100 hydrogen blend by volume?
Show answer
About 0.036.
Electric boiler CO₂ per MWh of steam at a grid average of 0.10 t/MWh and 0.99 efficiency?
Show answer
About 0.101 t/MWh.
What did EPA's September 2026 final rule keep?
Show answer
The efficiency-based standards for new and reconstructed turbines and the 2015 standards.
Lesson quiz · 5 questions
Score 60% or more to complete this lesson.
Create a free account to save your progress, take quizzes and earn a certificate.