
PWR-510 · Lesson 6 of 12 · 24 min
Engineering economics and life cycle cost
▶ Video coming soon A video version of this lesson is on the way.
Every engineering decision Anselm would make as chief would also be a financial decision, and Keswold's owner would judge his proposals the way it judged everyone's: by what they cost, what they returned and when. Morwenna had seen good engineers lose arguments they should have won because they could not put their case in the owner's terms. "Learn to speak money," she said. "Not because money matters more than safety, but because when you can show a project pays, you get to choose which safety and reliability work goes ahead first, instead of waiting to be told."
This lesson covers the time value of money, present worth and annuities, net present value, internal rate of return and payback, life cycle cost and equivalent annual cost, sensitivity and break-even analysis, and the practical cautions that keep an economic analysis honest. Pilar's work on the CHP study at Cantwell used the same tools at the Second Class level (PWR-410); here they are applied to the choices a chief engineer faces every year.
The time value of money
A dollar today is worth more than a dollar next year, because today's dollar can be invested and because future money is uncertain. Engineering economics compares costs and benefits that occur at different times by converting them to a common time, usually the present, with a discount rate. The rate an owner uses reflects its cost of capital and the risk of the investment, and many companies set a minimum acceptable rate of return, often called a hurdle rate, for each type of project. Keswold's owner uses 7 in 100 a year in real terms for plant improvement projects (a sample figure), higher for projects with uncertain benefits.
The present worth of an amount F received n years from now, at a discount rate i, is F divided by one plus i raised to the power n. A steady annual amount A over n years has a present worth equal to A times the annuity factor, often called the uniform series present worth factor. Its inverse, the capital recovery factor, converts a present amount into an equivalent annual amount.
At 7 in 100 over 20 years the annuity factor is 10.594, so a saving of 10,000 dollars a year for 20 years is worth about 105,900 dollars today. At 10 in 100 the same savings are worth only 85,100 dollars, and over 25 years at 7 in 100 they are worth 116,500. The discount rate and the life assumed matter a great deal, and an analysis should always state both.
Real rates and nominal rates must not be mixed. A real rate excludes inflation and is used with costs in today's dollars; a nominal rate includes inflation and is used with costs that escalate. Using a nominal rate with constant prices understates the value of future savings, and using a real rate with escalating prices overstates it. For energy projects, the price of fuel and electricity may be expected to rise faster or slower than general inflation, and the analysis should say which assumption it makes.
Net present value
The net present value (NPV) of a project is the present worth of all its benefits minus the present worth of all its costs, including the initial investment. A positive NPV at the owner's discount rate means the project earns more than the required return; the larger the NPV, the more value it adds. NPV is the most reliable single measure for comparing projects, because it accounts for the size of the project, the timing of its cash flows and the owner's cost of capital.
Worked problem
A more efficient cooling water pump
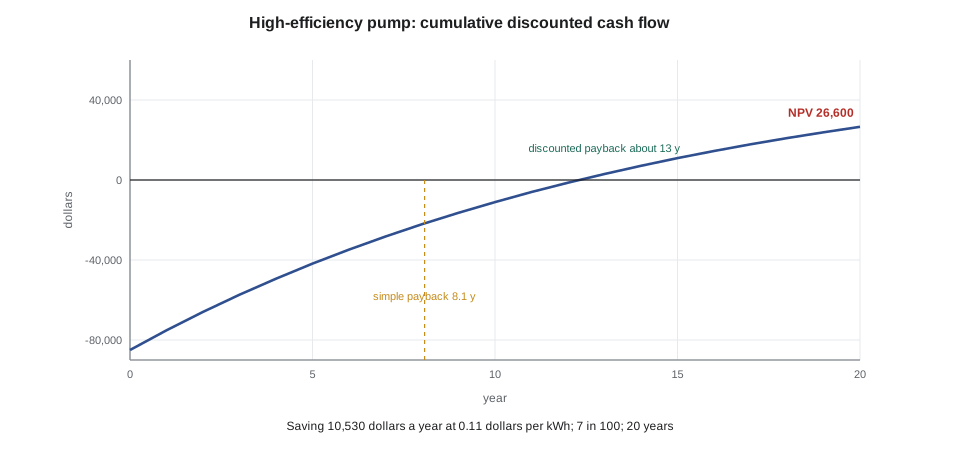
Keswold's cooling water pumps move about 13,050 gpm against about 82 ft of head (PWR-320). When the duty pump is due for replacement, the owner can buy a standard pump with an efficiency of 0.82 or a high-efficiency pump of 0.86, which costs 85,000 dollars more installed. The motor efficiency is 0.955 in either case, the pump runs about 8,000 hours a year, and electricity is worth 0.11 dollars per kWh (sample). Find the annual saving and the NPV over 20 years at 7 in 100.
Show solution
- \[P_h = \frac{13{,}050 \times 82}{3{,}960} = 270.2 \text{ hp} = 201.5 \text{ kW}\]
- \[\Delta P = \frac{201.5}{0.82 \times 0.955} - \frac{201.5}{0.86 \times 0.955} = 257.3 - 245.3 = 11.97 \text{ kW}\]
- \[\text{Saving} = 11.97 \times 8{,}000 \times 0.11 = 10{,}530 \text{ dollars/yr}\]
- \[NPV = 10{,}530 \times 10.594 - 85{,}000 = 26{,}600 \text{ dollars}\]
Answer: The high-efficiency pump saves about 96,000 kWh and 10,530 dollars a year and has an NPV of about 26,600 dollars, so it is worth buying at the owner's rate. The same pump at a plant with cheaper electricity would be a closer call, which is why a result from one plant cannot simply be copied to another.
Internal rate of return and payback
The internal rate of return (IRR) is the discount rate at which the NPV is zero. It is found by trial or with a spreadsheet function, and a project whose IRR exceeds the hurdle rate has a positive NPV at that rate. IRR is popular because it is a single percentage that does not need the discount rate to be stated, but it can mislead: it favors small projects with high returns over larger ones that add more value, it can give multiple answers when cash flows change sign more than once, and it assumes that returns can be reinvested at the IRR itself.
Simple payback is the initial cost divided by the annual saving. It ignores the time value of money and everything after the payback year, but it is easy to understand and a useful screen for risk: a project that pays back in two years is unlikely to disappoint badly. Discounted payback counts the years until the discounted savings recover the investment.
| Measure | High-efficiency cooling water pump |
|---|---|
| Annual saving | 10,530 dollars |
| Simple payback | 8.1 years |
| Discounted payback at 7 in 100 | about 13 years |
| NPV at 7 in 100, 20 years | 26,600 dollars |
| IRR | about 10.8 in 100 |
Many owners ask for all three measures, and many set rules such as "payback under five years" for small efficiency projects. Morwenna's advice was to present NPV as the main measure, IRR and payback as supporting measures, and to explain why a project with a long payback but a large NPV, such as the pump, deserves approval.
Life cycle cost
The life cycle cost (LCC) of an asset is the present worth of every cost it brings over its life: purchase and installation, energy, maintenance and repairs, downtime, operating labor, and disposal, less any salvage value. For many plant assets, the purchase price is a small part of the total. A pump or fan that runs continuously typically spends many times its purchase price on electricity over its life, so a few points of efficiency are worth far more than a lower bid. LCC is the right basis for comparing bids, as lesson 3 suggested, and for deciding between repair and replacement.
- Capital: purchase, installation, engineering, commissioning, spares.
- Energy: fuel or electricity at the expected load profile, prices and escalation.
- Maintenance: planned maintenance, expected repairs and overhauls.
- Downtime: lost production or the cost of a standby supply while the asset is down.
- Disposal: removal, decontamination and disposal, less salvage.
Comparing options with different lives
Two options with different lives cannot be compared by their present worth alone, because one buys more years of service than the other. The usual method is the equivalent annual cost: convert each option's capital cost to an equal annual amount with the capital recovery factor for its own life, add its annual costs, and compare the totals.
Worked problem
Rebuild or replace?
A condensate pump at Keswold can be rebuilt for 18,000 dollars, which would give about 8 more years of service with maintenance of about 3,000 dollars a year, or replaced with a new pump for 45,000 dollars installed, expected to last 20 years with maintenance of about 1,000 dollars a year. Compare the equivalent annual costs at 7 in 100, assuming the two pumps use the same energy.
Show solution
- \[EAC_{rebuild} = 18{,}000 \times 0.1675 + 3{,}000 = 6{,}010 \text{ dollars/yr}\]
- \[EAC_{new} = 45{,}000 \times 0.0944 + 1{,}000 = 5{,}250 \text{ dollars/yr}\]
Answer: The new pump costs about 760 dollars a year less over its life, even though its purchase price is two and a half times higher. If the new pump were also more efficient, as in the previous example, the case would be stronger. If the plant expected to close or change its duty within eight years, the rebuild would win, which shows why the expected life of the plant belongs in the analysis.
Sensitivity and break-even analysis
Every economic analysis rests on assumptions that may be wrong: prices, hours, efficiencies, costs and lives. A sensitivity analysis changes each important assumption over a reasonable range and shows how the result moves. A break-even analysis finds the value of an assumption at which the decision would change. A decision-maker who knows that a project still pays if electricity falls to two thirds of today's price can approve it with more confidence than one who has only a single NPV.
Worked problem
At what electricity price does the pump stop paying?
For the high-efficiency pump, find the electricity price at which the NPV over 20 years at 7 in 100 is zero.
Show solution
- \[c_{be} = \frac{85{,}000}{95{,}750 \times 10.594} = 0.084 \text{ dollars/kWh}\]
Answer: The pump pays as long as electricity costs more than about 0.084 dollars per kWh, about three quarters of the sample price. The decision is fairly robust to a fall in price, but not to a large one, and it would also change if the pump ran far fewer hours.
A tornado chart, which ranks the assumptions by how much each moves the NPV, is a good way to show the results. For energy projects the largest bars are usually energy price, operating hours and capital cost; for reliability projects they are the probability of failure and the cost of the downtime it causes.
Valuing reliability and risk
Many of a chief engineer's proposals are not about saving energy but about avoiding failures: a spare transformer, a second feed pump, an inspection program, a standby boiler. Their benefit is a reduction in expected loss, the probability of a failure times its consequence, which is the same idea that underlies risk-based inspection (lesson 7). A spare that costs 60,000 dollars a year to own and reduces the expected cost of outages by 150,000 dollars a year adds value even though it may never be used. These estimates are uncertain, so they should be presented with their basis and a range.
Taxes also matter to the owner, though less to the engineering decision. In Canada, the capital cost allowance system, and in the United States, depreciation schedules and energy investment tax credits, can change the after-tax value of a project, and some clean energy equipment receives accelerated or enhanced treatment. The chief engineer's job is to provide sound engineering costs and benefits and to work with the owner's finance staff, who apply the tax rules.
Keeping the analysis honest
Morwenna had a list of the ways economic analyzes go wrong, and she asked Anselm to check every proposal against it.
- Counting a saving that will happen anyway, or one that belongs to another project.
- Using full-load efficiency for equipment that runs mostly at part load.
- Ignoring the cost of downtime to install the new equipment.
- Assuming a life longer than the plant itself is expected to run.
- Mixing real and nominal rates.
- Leaving out maintenance, spares, training and the engineering of the change.
- Presenting a single number without its assumptions and a range.
"A good analysis can be checked by someone who disagrees with you," Morwenna said. "Show your assumptions, show the sensitivity, and let the numbers carry the argument."
Presenting the case
The owner's capital committee sees dozens of proposals a year and reads the first page of each. Morwenna's format for an economic case fits on that page: what is proposed and why, the cost and its estimate class, the annual benefit and its basis, the NPV, IRR and payback at the owner's rate, the key sensitivities and break-even values, the risks, and what happens if the project is not done. The calculations go in an appendix that anyone can check. A proposal written this way is approved faster, and when it is turned down, the reason is usually clear enough to fix.
Common mistakes
MistakeComparing options on purchase price alone.
InsteadCompare life cycle costs, including energy, maintenance, downtime and disposal.
MistakeUsing IRR alone to rank projects of different sizes.
InsteadUse NPV as the main measure; IRR and payback support it.
MistakeComparing present worths of options with different lives.
InsteadUse equivalent annual cost over each option's own life.
MistakeMixing real discount rates with escalating prices.
InsteadUse real rates with constant prices or nominal rates with escalating prices.
MistakePresenting one NPV without sensitivity.
InsteadShow how the result changes with key assumptions and where it breaks even.
MistakeIgnoring the value of reliability projects because they save no energy.
InsteadValue them by the reduction in expected loss, with a stated basis and range.
Summary and key terms
- Costs and benefits at different times are compared by discounting at the owner's rate; real and nominal rates must not be mixed.
- NPV is the most reliable single measure; a positive NPV means the project earns more than the required return.
- IRR is the rate at which NPV is zero; simple and discounted payback are useful risk screens but ignore later benefits.
- Life cycle cost includes capital, energy, maintenance, downtime and disposal; for continuously running equipment, energy usually dominates.
- Options with different lives are compared by equivalent annual cost.
- Sensitivity and break-even analyzes show how robust a decision is; reliability projects are valued by the reduction in expected loss.
- Discount rate
- The rate used to convert future amounts to present worth.
- Hurdle rate
- The minimum rate of return an owner requires of a project.
- Annuity factor
- The present worth of one dollar a year for n years at a given rate.
- Capital recovery factor
- The factor that converts a present amount into an equal annual amount.
- Net present value
- The present worth of benefits minus the present worth of costs.
- Internal rate of return
- The discount rate at which a project's NPV is zero.
- Life cycle cost
- The present worth of all costs of an asset over its life.
- Equivalent annual cost
- The uniform annual cost equivalent to an option's capital and annual costs over its life.
- Break-even
- The value of an assumption at which a decision changes.
Practice problems
Work each problem on paper first, then reveal the answer to check.
Present worth of 50,000 dollars received in 10 years at 7 in 100?
Show answer
About 25,400 dollars.
Present worth of 8,000 dollars a year for 20 years at 7 in 100?
Show answer
About 84,800 dollars.
Simple payback of a 60,000 dollar project saving 9,000 dollars a year?
Show answer
6.7 years.
Equivalent annual cost of 100,000 dollars over 15 years at 7 in 100, with no annual costs?
Show answer
About 10,980 dollars a year.
Lesson quiz · 5 questions
Score 60% or more to complete this lesson.
Create a free account to save your progress, take quizzes and earn a certificate.