
HSE-240 · Lesson 3 of 12 · 32 min
Assessing exposure
Respirator selection depends on a number: the concentration the worker would breathe without protection. That number comes from an exposure assessment. Without it, selection is guesswork, and guesswork in respiratory protection tends to fail in one of two ways: a respirator that is too weak, or an expensive, uncomfortable respirator that workers will not wear because it is far stronger than needed. This lesson explains how exposures are assessed, how air sampling and direct-reading instruments work, how to calculate a time-weighted average and how to deal with uncertainty.
The exposure assessment process
An exposure assessment is a structured process, not a single air sample. Professional occupational hygiene practice, reflected in guidance from bodies such as the American Industrial Hygiene Association and the occupational hygiene associations in Canada, follows a cycle that looks like this.
| Step | What happens | Output |
|---|---|---|
| 1. Basic characterization | Gather information on the process, materials (safety data sheets), tasks, workers, schedules, existing controls and past data | A list of agents and tasks of concern |
| 2. Define similar exposure groups | Group workers who do similar tasks with similar materials and controls | Groups that can be sampled representatively |
| 3. Judge exposures | Use professional judgment, data and models to estimate each group's exposure relative to the limit | Each group rated as acceptable, uncertain or unacceptable |
| 4. Gather more data where needed | Sample groups whose exposure is uncertain or near the limit | Measured exposure profiles |
| 5. Control and re-assess | Implement controls, including respirators where needed, and re-evaluate when processes change | Updated control plan and periodic reassessment |
Similar exposure groups are an important idea. Sampling every worker every day is impossible, so hygienists identify groups whose exposures should be alike, such as all the welders on a production line, and sample enough of them to describe the group. If one worker in a group turns out to be very different, the grouping is wrong and needs revisiting.
Personal air sampling
The reference method for comparing exposure with a TWA limit is personal breathing-zone sampling. A small battery-powered pump worn on the worker's belt draws air at a known flow rate through a collection device clipped near the collar, within about 30 centimeters of the nose and mouth. After the sample, the collection device goes to an accredited laboratory, which measures the mass of contaminant collected.
| Contaminant | Typical collection device | Analysis |
|---|---|---|
| Total or inhalable dust | Filter cassette or inhalable sampler | Weighing |
| Respirable dust and silica | Cyclone that removes larger particles, then a filter | Weighing; X-ray diffraction or infrared for silica |
| Metals (lead, manganese, chromium) | Filter cassette | Acid digestion and spectroscopy |
| Organic vapors | Charcoal or other sorbent tube, or passive badge | Gas chromatography |
| Isocyanates and some reactive chemicals | Treated filter or impinger | Liquid chromatography |
| Asbestos and other fibers | Filter cassette with extension cowl | Fiber counting by microscopy |
The concentration is calculated from the mass collected and the volume of air sampled.
Here \(m\) is the mass in milligrams, \(Q\) is the flow rate in cubic meters per minute and \(t\) is the sampling time in minutes. Pumps are usually set in liters per minute, so remember that 1,000 liters equal 1 cubic meter. Pumps must be calibrated before and after each sample with a primary flow calibrator; if the flow changes by more than about 5 percent, the sample may be invalid.
Worked problem
Calculating a respirable dust concentration
A cyclone sampler runs at 2.5 L/min for 420 minutes. The laboratory reports 0.32 mg of respirable dust on the filter. What is the average concentration during sampling?
Show solution
- Air volume = 2.5 L/min × 420 min = 1,050 L = 1.05 m³.
- Concentration = 0.32 mg ÷ 1.05 m³ = 0.30 mg/m³.
Answer: About 0.30 mg/m³ over the 420-minute sample. Whether this is a full-shift TWA depends on what happened during the unsampled time.
Calculating an 8-hour TWA
A full-shift sample is ideal, but workers often move between tasks and sample media sometimes need changing during the shift. The TWA is calculated by weighting each concentration by its duration.
Always divide by 8 hours for an 8-hour limit, even if the worker worked less, and account for any unsampled time. If the worker was exposed during unsampled time, you need a reasonable estimate; if the worker was genuinely unexposed, for example in a clean lunchroom, that period counts as zero.
Worked problem
A multi-period TWA
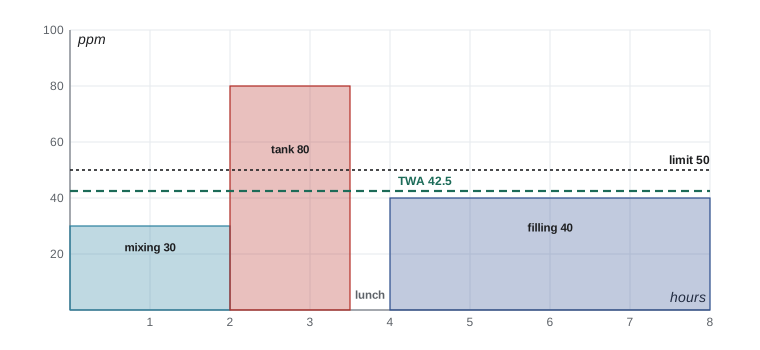
A worker's sampling results are: 2 hours at 30 ppm while mixing, 1.5 hours at 80 ppm while cleaning a tank, 0.5 hours at 0 ppm at lunch away from the area, and 4 hours at 40 ppm while filling. The 8-hour TWA limit is 50 ppm and the STEL is 100 ppm. Is the worker over the TWA limit?
Show solution
- Weighted sum: 30 × 2 = 60; 80 × 1.5 = 120; 0 × 0.5 = 0; 40 × 4 = 160.
- Total = 60 + 120 + 0 + 160 = 340 ppm-hours.
- TWA = 340 ÷ 8 = 42.5 ppm.
- The TWA is below 50 ppm. But the tank cleaning averaged 80 ppm over 90 minutes; short-term peaks within that task may have exceeded the 100 ppm STEL, so short-term sampling of that task is needed.
Answer: The TWA of 42.5 ppm is below the limit, but it is 85 percent of it, and the tank cleaning task needs short-term sampling to check the STEL. Most hygienists would treat this group as needing better controls.
Direct-reading instruments
Direct-reading instruments give results in real time. They are essential for some decisions, such as whether a confined space is safe to enter or whether an area is above an immediately dangerous level, and they are very useful for finding sources and peaks. Common types include multi-gas monitors with oxygen, flammable gas, carbon monoxide and hydrogen sulfide sensors; photoionization detectors for many organic vapors; electrochemical sensors for specific gases; and optical aerosol monitors that estimate particle concentrations.
| Instrument | Strengths | Limitations |
|---|---|---|
| Multi-gas monitor | Immediate alarms for oxygen, flammables and toxic gases; required for many confined space entries | Only measures the gases it has sensors for; sensors drift and need bump tests and calibration |
| Photoionization detector (PID) | Detects many organic vapors at low ppm levels quickly | Does not identify which vapor; response varies by chemical and needs correction factors |
| Colorimetric detector tubes | Simple and cheap for spot checks of specific gases | Low accuracy, cross-sensitivities, single reading |
| Optical aerosol monitor | Shows dust peaks and helps evaluate controls | Reads in arbitrary units unless calibrated against a filter sample for that dust |
Direct-reading results are usually not a substitute for laboratory-analyzed personal samples when comparing with TWA limits, but they are often the best tool for short-term limits, ceilings and emergency decisions. Instruments must be bump-tested before each day's use and calibrated as the manufacturer specifies, and users must be trained to understand cross-sensitivities. A carbon monoxide sensor that also responds to hydrogen, for example, can give misleading readings near battery charging.
Estimating exposure when you cannot measure first
Respirators often have to be chosen before sampling results are available, for example on the first day of a new task or for a one-off maintenance job. In that case the assessment relies on other sources: previous sampling from similar tasks, published data, trade association guidance, manufacturer data and simple models. When the estimate is uncertain, the respirator choice should be conservative until data are available.
One simple model estimates the steady-state concentration in a well-mixed room from the rate at which a contaminant is released and the ventilation rate.
Here \(G\) is the generation rate (for example in mg/min) and \(Q\) is the effective ventilation rate (m³/min). Real rooms are not well mixed, and concentrations near the source can be many times higher, so this model gives a lower bound for the worker at the source. It is useful mostly for ruling things in, not out.
Worked problem
A quick well-mixed estimate
A worker evaporates 100 g of a solvent per hour in a room ventilated at 50 m³/min. Estimate the average room concentration in mg/m³, assuming good mixing.
Show solution
- Generation rate: 100 g/h = 100,000 mg ÷ 60 min = 1,667 mg/min.
- Steady-state concentration: 1,667 ÷ 50 = 33 mg/m³.
- The worker at the source will usually breathe a much higher concentration than the room average.
Answer: About 33 mg/m³ as a room average. Treat the worker's breathing-zone concentration as likely higher until it is measured.
Dealing with variability
Exposures vary a great deal from day to day, even for the same worker doing the same job. Occupational exposures typically follow a lognormal distribution: most days are moderate, but a few days are much higher. A single sample tells you little about that distribution. A single result at 40 percent of the limit does not mean the worker is always below the limit; on some days the worker may be well above it.
Professional practice compares a statistic, such as the estimated 95th percentile of the group's exposures, with the limit. Many programs use these rules of thumb: if the 95th percentile is clearly below the limit, exposure is acceptable; if it is near or above the limit, more controls are needed. Statistical tools for this are freely available, but the key idea for supervisors is that a few results near the limit signal a problem, not a pass.
Worked problem
Reading a small data set
Five full-shift samples for a group of grinders give respirable silica results of 0.010, 0.018, 0.012, 0.031 and 0.022 mg/m³. The limit is 0.025 mg/m³. One result is above the limit and the average is 0.019 mg/m³. Is the group's exposure acceptable?
Show solution
- The arithmetic average is below the limit, but one of five results (20 percent) exceeds it.
- With lognormal variation, if 20 percent of measured days exceed the limit, the true fraction of days above the limit is likely substantial.
- The group's 95th percentile is clearly above the limit.
Answer: No. The group is regularly overexposed. Engineering controls must be improved, and respirators are needed in the meantime, selected for the higher end of the exposure range, not the average.
Using results for respirator selection
For respirator selection, the number that matters is not the average exposure but a reasonable upper estimate of the concentration the worker could face during the task. Programs commonly use the highest measured value for a task, an upper percentile, or a modeled worst case. Selection must also consider short-term peaks, because a respirator chosen against the TWA may be overwhelmed during a peak that is 10 or 20 times higher.
Exposure assessment is not a one-time event. Reassess when materials, processes, equipment or controls change, when workers report symptoms or odors, when medical surveillance shows a problem, when limits change, and periodically even when nothing seems to have changed. Keep records: who was sampled, what task, what controls and respirators were in use, the result and the laboratory report. Those records support selection decisions and may be needed decades later for occupational disease claims.
In the United States, 29 CFR 1910.1020 gives workers and their designated representatives the right to access exposure and medical records, and exposure records must generally be kept for 30 years. Substance-specific standards add requirements to notify workers of monitoring results within a set number of days.
Common mistakes
MistakeChoosing a respirator from a single sample at 40 percent of the limit.
InsteadUse enough data to understand variability, and select against an upper estimate, not one result.
MistakeDividing the weighted sum by the sampled time instead of 8 hours.
InsteadFor an 8-hour TWA, divide by 8 hours and account for unsampled time.
MistakeUsing an uncalibrated pump or skipping post-calibration.
InsteadCalibrate before and after each sample with a primary calibrator.
MistakeTreating a photoionization detector reading as the concentration of a specific chemical without correction.
InsteadApply the correction factor for the chemical, and remember the PID does not identify substances.
MistakeAssuming the room-average model describes the worker at the source.
InsteadExpect much higher concentrations near the source; use the model only as a lower bound.
MistakeNever reassessing once respirators are issued.
InsteadReassess when processes, materials, controls or limits change, and periodically.
Summary and key terms
- Exposure assessment is a cycle: characterize, group workers, judge exposures, gather data where uncertain, control and reassess.
- Personal breathing-zone sampling with calibrated pumps and laboratory analysis is the reference method for TWA comparisons.
- Concentration equals mass collected divided by air volume; 1,000 liters equal 1 m³.
- An 8-hour TWA weights each period by its duration and is always divided by 8 hours.
- Direct-reading instruments are essential for peaks, ceilings, confined spaces and emergencies, but have cross-sensitivities and need bump tests and calibration.
- Exposures vary lognormally; several results near the limit signal a problem even when the average is below it.
- Respirators should be selected against a reasonable upper estimate of concentration, including short-term peaks.
- Exposure assessment
- The process of characterizing and judging workers' exposures to hazardous agents.
- Similar exposure group
- Workers expected to have similar exposure profiles because of similar tasks, materials and controls.
- Breathing zone
- The area within about 30 centimeters of a worker's nose and mouth.
- Personal sampling pump
- A battery-powered pump worn by the worker that draws air through a collection device at a known flow rate.
- Cyclone
- A sampling device that removes larger particles so that only the respirable fraction reaches the filter.
- Direct-reading instrument
- An instrument that displays concentrations in real time.
- Bump test
- A brief exposure of a gas monitor to a known gas to confirm that sensors and alarms respond.
- Lognormal distribution
- A skewed distribution typical of exposures, with most values moderate and a few much higher.
- 95th percentile
- The value below which 95 percent of a group's exposures are expected to fall.
- Generation rate
- The rate at which a contaminant is released into the air.
Practice problems
Work each problem on paper first, then reveal the answer to check.
Why are similar exposure groups used?
Show answer
Sampling every worker every day is impossible, so representative workers are sampled to describe groups with similar exposures.
A pump runs at 2.0 L/min for 480 minutes and collects 0.12 mg. What is the concentration?
Show answer
0.12 mg ÷ 0.96 m³ = 0.125 mg/m³.
Calculate the 8-hour TWA for 4 hours at 20 ppm, 2 hours at 60 ppm and 2 hours unexposed.
Show answer
(80 + 120 + 0) ÷ 8 = 25 ppm.
Why must pumps be calibrated before and after sampling?
Show answer
To confirm the flow rate used in the calculation; a large change can invalidate the sample.
Give one strength and one limitation of a photoionization detector.
Show answer
It detects many organic vapors quickly, but it does not identify the chemical and needs correction factors.
What is a bump test?
Show answer
A brief exposure to a known gas to confirm that the monitor's sensors and alarms respond.
A room has a generation rate of 500 mg/min and ventilation of 25 m³/min. Estimate the well-mixed concentration.
Show answer
500 ÷ 25 = 20 mg/m³, likely higher at the source.
Why can a group with an average below the limit still be overexposed?
Show answer
Exposures vary; individual days can exceed the limit, and the upper percentile may be above it.
Which concentration should guide respirator selection?
Show answer
A reasonable upper estimate for the task, including short-term peaks, not the average.
Name three triggers for reassessing exposure.
Show answer
Changes to materials, processes or controls; symptoms or complaints; changed limits; and periodic review.
Lesson quiz · 5 questions
Score 60% or more to complete this lesson.
Create a free account to save your progress, take quizzes and earn a certificate.