
GEOM-320 · Lesson 1 of 12 · 27 min
Electromagnetic radiation and the atmosphere
The irrigation district's new canal was running by its second summer, and the board wanted to know what the water was doing once it left the canal. Marta Kowalchuk, the district's water manager, asked Coulee Geomatics for a monitoring program that would map the irrigated fields and crops every season, estimate how much water the crops were using, watch the coulee banks along the canal for slow movement, look for seepage below the embankments and give quick maps when a flood or grass fire threatened the works. The service area west of Great Falls covers about 30,000 ha, far too much to survey on the ground every month. Ruth Albrecht, the principal, gave the analysis to Leah Tran, the engineer in training who had worked on the control survey and the photogrammetric mapping, with Theo Martel on data processing and Grant Okonkwo's crew collecting field observations. Leah's first task was to explain to the board why a satellite can say anything at all about a field 700 km below it. This lesson starts where every remote sensing measurement starts: with electromagnetic radiation, how it is produced, how it is described and what happens to it in the atmosphere.
What remote sensing measures
Remote sensing is the measurement of the properties of objects without touching them, by recording electromagnetic radiation that they reflect, emit or scatter. The photogrammetry of the previous course used the same radiation, but for geometry: where a point is. Remote sensing in the sense of this course is mostly about radiometry, how much radiation arrives at the sensor in each part of the spectrum, and what that says about the surface: whether a field is green, wet, bare or burned; whether water is clear or muddy; how warm a canal bank is at midday; how rough or moist a soil is to a radar.
Every measurement follows a chain. A source provides energy: the Sun for reflected optical sensing, the Earth itself for thermal sensing, and the sensor's own transmitter for radar and lidar. The energy passes through the atmosphere, interacts with the surface, passes through the atmosphere again and reaches a sensor on an aircraft, drone or satellite. The sensor converts it to digital numbers, which are transmitted, calibrated, corrected, analyzed and interpreted, and finally turned into information that someone can act on, such as a map of fields that received water this week. Errors and uncertainty enter at every link, and much of the work of a remote sensing engineer is tracing a surprising result back along the chain to find which link caused it.
Systems that rely on the Sun or on the Earth's own emission are called passive. Systems that provide their own illumination, such as synthetic aperture radar and lidar, are active. Passive optical sensing works only in daylight and through a cloudless sky; thermal sensing works by day and night but not through cloud; radar works day and night and through most cloud and smoke, which is why it is the backbone of flood mapping on the prairies in spring.
Electromagnetic radiation
Electromagnetic radiation is energy carried by coupled electric and magnetic fields traveling at the speed of light, \(c = 2.998 \times 10^{8}\) m/s in a vacuum. It can be described as a wave with wavelength \(\lambda\) and frequency \(\nu\), related by \(c = \lambda \nu\), or as a stream of photons, each with energy \(E = h\nu = hc/\lambda\), where \(h = 6.626 \times 10^{-34}\) J s is Planck's constant. Both descriptions are needed. The wave view explains diffraction, polarization and the coherence that radar interferometry depends on. The photon view explains why short wavelengths carry more energy per photon, why detectors for long wavelengths are harder to build and often need cooling, and why there is a fundamental noise floor in counting photons.
Optical remote sensing describes wavelength in micrometers (µm) or nanometers (nm); radar engineers more often use frequency in gigahertz together with a band letter. The regions of the spectrum used in this course are listed in the table. The boundaries are conventions rather than physical edges, and different agencies draw them slightly differently.
| Region | Wavelength | Main source | Typical uses |
|---|---|---|---|
| Ultraviolet | 0.01 to 0.4 µm | Sun | Little used from orbit; strongly scattered and absorbed by ozone |
| Visible | 0.4 to 0.7 µm | Sun | Color, water quality, chlorophyll absorption, true-color mapping |
| Near infrared (NIR) | 0.7 to 1.3 µm | Sun | Vegetation vigor, water boundaries, biomass |
| Shortwave infrared (SWIR) | 1.3 to 3 µm | Sun | Leaf and soil moisture, minerals, burn scars, snow and cloud |
| Midwave infrared (MWIR) | 3 to 8 µm | Sun and Earth | Active fires and hot spots |
| Thermal infrared (TIR) | 8 to 15 µm | Earth | Surface temperature, evapotranspiration, seepage |
| Microwave | 1 mm to 1 m | Radar transmitter or Earth | Radar imaging, InSAR, soil moisture |
Describing radiation: radiometric quantities
The quantities of radiometry are precise and easily confused. Radiant energy \(Q\) is measured in joules, and radiant flux \(\Phi = dQ/dt\) in watts. Flux arriving per unit area of a surface is irradiance \(E\), in W m⁻², and flux leaving a surface per unit area is exitance \(M\). Radiance \(L\) is flux per unit area per unit solid angle in a given direction, in W m⁻² sr⁻¹, and it is the quantity a sensor actually measures: a detector looking through a small aperture at a small patch of ground collects radiation from a narrow cone of directions. When any of these is given per unit wavelength it becomes spectral, so that spectral radiance has units of W m⁻² sr⁻¹ µm⁻¹.
Radiance has a useful property: in the absence of absorption or scattering it is conserved along a ray, so the radiance a sensor records does not depend on how far away the surface is. A field looks equally bright from a drone at 100 m and from a satellite at 700 km, apart from the atmosphere in between; what changes with distance is how much ground each detector sees. This is why sensors are calibrated in radiance and why images from different heights can be compared.
A surface that reflects equally in all directions is called Lambertian. Its radiance is the same from every viewing angle and is related to its exitance by \(M = \pi L\). Real surfaces are not Lambertian: crops are brighter when viewed with the Sun behind the observer (the hot spot, where shadows are hidden) and water is very bright near the direction of mirror reflection (sun glint). The full directional behavior is described by the bidirectional reflectance distribution function, and it matters when images from different dates, sensors or view angles are compared. For most of this course reflectance means the ratio of reflected to incident flux, a number between 0 and 1 that describes the surface rather than the illumination.
Radiation from hot bodies
Every object above absolute zero emits radiation. An ideal emitter, a blackbody, emits the maximum possible at every wavelength, given by Planck's law:
where \(k = 1.381 \times 10^{-23}\) J/K is Boltzmann's constant and \(T\) is the absolute temperature. Integrating over all wavelengths gives the Stefan-Boltzmann law for total exitance, \(M = \sigma T^4\) with \(\sigma = 5.67 \times 10^{-8}\) W m⁻² K⁻⁴, so doubling the absolute temperature multiplies the emitted power by sixteen. Differentiating gives Wien's displacement law for the wavelength of peak emission, \(\lambda_{max} = b/T\) with \(b = 2898\) µm K. The Sun, with an effective surface temperature near 5800 K, peaks near 0.5 µm in the green, close to where human vision is most sensitive. The ground at about 300 K peaks near 10 µm, in the middle of the thermal infrared window, which is why thermal sensors are built for 8 to 14 µm.
Real surfaces emit less than a blackbody at the same temperature. The ratio is the emissivity \(\varepsilon\), between 0 and 1 and generally a function of wavelength. Water and dense vegetation have thermal emissivities near 0.98 to 0.99, dry soils and rocks often 0.92 to 0.96, and polished metal very low values, which is why a metal roof can look cold to a thermal camera on a hot day. Kirchhoff's law states that, at a given wavelength and in thermal equilibrium, emissivity equals absorptivity, so a good absorber is a good emitter. For an opaque surface reflectance and emissivity add to one, \(\rho + \varepsilon = 1\), which links the reflective and thermal parts of the spectrum.
Worked problem
Peak wavelength and emitted power
The canal water at 22 °C and a gravel road at 38 °C are both in a July thermal image. Find the wavelength of peak emission for each and the ratio of their total emitted power, treating both as blackbodies.
Show solution
- \[T_w = 22 + 273.15 = 295.15 \text{ K}, \quad T_r = 38 + 273.15 = 311.15 \text{ K}\]
- \[\lambda_{max,w} = \frac{2898}{295.15} = 9.82 \text{ µm}, \quad \lambda_{max,r} = \frac{2898}{311.15} = 9.31 \text{ µm}\]
- \[\frac{M_r}{M_w} = \Big(\frac{311.15}{295.15}\Big)^4 = 1.054^4 = 1.235\]
Answer: Both peak near 9 to 10 µm, inside the thermal window, and the road emits about 24 % more power than the water although it is only 16 K warmer. The strong temperature dependence is what makes thermal sensing sensitive to small differences.
Interactions at the surface
Radiation reaching a surface is reflected, absorbed or transmitted, and the three fractions add to one at each wavelength: \(\rho_\lambda + \alpha_\lambda + \tau_\lambda = 1\). Which of the three dominates depends on the material and on wavelength, and that dependence is the basis of remote sensing. Green leaves absorb most red and blue light for photosynthesis, reflect a moderate amount of green, and reflect and transmit roughly half of the near infrared because of scattering at the boundaries between cell walls and air spaces inside the leaf. Water absorbs nearly all near and shortwave infrared within a few centimeters, so even a thin film of water looks dark in those bands. The details belong to the next lesson; here the point is that every surface has a spectral fingerprint only because these interactions vary with wavelength.
Reflection can be specular, as from calm water or a metal roof, where the angle of reflection equals the angle of incidence, or diffuse, as from a plowed field or a canopy, where radiation is scattered in many directions. Whether a surface behaves as smooth or rough depends on the size of its irregularities relative to the wavelength. A gravel road is rough to visible light but smooth to an L-band radar with a 24 cm wavelength; calm water is smooth to both, which is why it appears black in radar images: the radar pulse is reflected away from the antenna.
The atmosphere
Between the surface and a satellite lie about 10 metric tons of air over every square meter, containing nitrogen, oxygen, water vapor, carbon dioxide, ozone, aerosols such as dust and wildfire smoke, and often cloud. The atmosphere affects radiation in two ways: it scatters it, changing its direction, and it absorbs it, converting it to heat. Both depend on wavelength, and together they decide which parts of the spectrum can be used at all.
Rayleigh scattering is caused by molecules much smaller than the wavelength. Its strength varies as \(\lambda^{-4}\), so blue light at 0.45 µm is scattered about thirteen times more than near infrared at 0.85 µm. It makes the sky blue, makes distant hills look bluish and hazy, and adds a bright veil to the blue band of every satellite image. Mie scattering is caused by particles comparable in size to the wavelength, such as smoke, dust and pollen; it is less wavelength-dependent and concentrated in the forward direction, and it explains the milky look of the prairie sky on days when smoke has drifted from fires hundreds of kilometers away. Non-selective scattering by cloud droplets and ice crystals, much larger than visible wavelengths, scatters all visible and near infrared wavelengths about equally, which is why clouds are white.
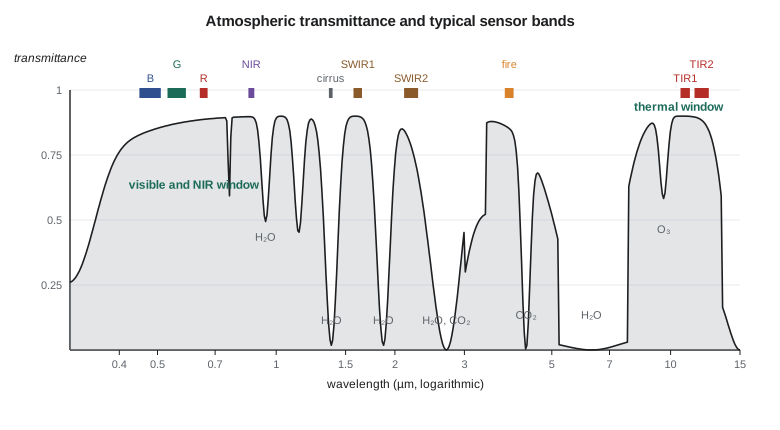
Absorption is concentrated in bands where particular gases have molecular transitions. Ozone absorbs nearly all ultraviolet below about 0.3 µm. Water vapor absorbs strongly near 0.94, 1.14, 1.38, 1.87 and 2.7 µm and in broad regions of the thermal infrared; carbon dioxide absorbs near 2.0, 4.3 and 15 µm; oxygen has a narrow band at 0.76 µm. The regions between absorption bands where most radiation gets through are called atmospheric windows. Sensor bands are placed in the windows, with a few deliberately placed in absorption bands for special purposes: a band at 1.38 µm, where water vapor absorbs strongly, sees almost nothing of the ground and therefore shows thin high cirrus cloud clearly against a dark background, which is valuable for screening cloud.
Paths of radiation to the sensor
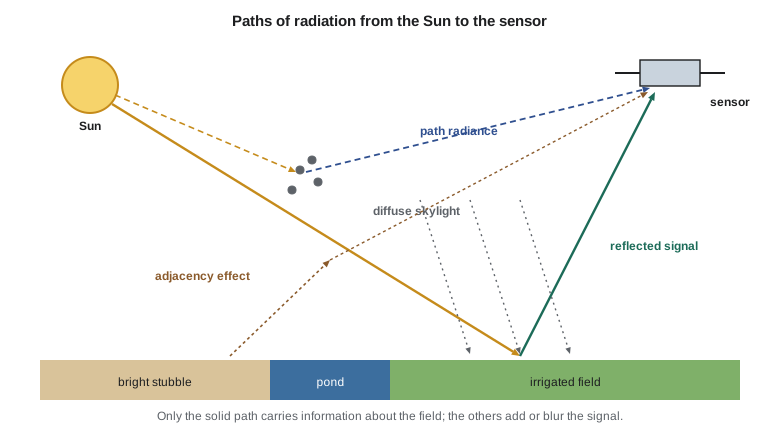
The radiance recorded by a satellite over a field is the sum of several contributions. The wanted signal is sunlight that passed through the atmosphere, was reflected by the field and passed through the atmosphere again to the sensor. Added to it is path radiance, sunlight scattered into the sensor's view by the atmosphere without ever reaching the ground, which brightens dark targets such as water and shadow and is largest in the blue. The field is lit not only by the direct beam but also by diffuse skylight, which is why shadows on the coulee walls are not black. Finally, the adjacency effect adds light reflected by neighboring surfaces and scattered into the line of sight, so a small dark pond surrounded by bright stubble appears brighter than it really is.
In this simplified form, \(T_{up}\) is the upward transmittance from surface to sensor, \(E_{dir}\) is the direct solar irradiance at the surface after downward transmittance, \(E_{dif}\) is diffuse skylight, and \(\rho\) is the surface reflectance, assumed Lambertian. Atmospheric correction, the subject of Lesson 5, estimates the path radiance, transmittances and diffuse irradiance and inverts this equation for \(\rho\). The direct transmittance through a layer with optical depth \(\tau\) along a slant path follows the Beer-Lambert law, \(T = e^{-\tau / \cos\theta}\), where \(\theta\) is the zenith angle of the path, so low sun in October and the long slant path at the edges of a wide swath both reduce the signal.
Reflected and emitted radiation
At short wavelengths the radiance from the Earth's surface is almost entirely reflected sunlight; at long wavelengths it is almost entirely the surface's own emission. The crossover lies in the midwave infrared, between about 3 and 5 µm, where both contribute and where the interpretation of a measurement needs care. The code below compares sunlight reflected by a field with the field's own emission. The solar spectrum at the Earth is obtained from Planck's law at 5778 K scaled by the square of the ratio of the solar radius to the Earth-Sun distance, which accounts for the spreading of sunlight over 150 million kilometers.
import math
h = 6.62607015e-34   # Planck constant, J s
c = 2.99792458e8     # speed of light, m/s
k = 1.380649e-23     # Boltzmann constant, J/K
b = 2.897771955e-3   # Wien constant, m K

def planck(lam_um, T):
    """Spectral radiance in W m-2 sr-1 um-1 for wavelength in um."""
    lam = lam_um * 1e-6
    B = 2 * h * c**2 / lam**5 / (math.exp(h * c / (lam * k * T)) - 1.0)
    return B * 1e-6

for name, T in (("Sun", 5778.0), ("Canal water in July", 295.0), ("Fresh snow", 268.0)):
    print(f"{name:20s} T = {T:6.0f} K   Wien peak = {b / T * 1e6:6.2f} um")

print()
# Sunlight reflected by a field with reflectance 0.10, Sun 30 deg from zenith,
# compared with the field's own emission at 295 K (emissivity 0.97)
dil = (6.957e8 / 1.496e11) ** 2          # (solar radius / Earth-Sun distance) squared
print("Wavelength   reflected sunlight   emitted by the field   (W m-2 sr-1 um-1)")
for lam in (0.48, 0.66, 0.86, 1.6, 2.2, 3.9, 10.9):
    refl = 0.10 * planck(lam, 5778.0) * dil * math.cos(math.radians(30.0))
    emit = 0.97 * planck(lam, 295.0)
    print(f"  {lam:5.2f} um   {refl:12.4e}        {emit:12.4e}")

# Rayleigh scattering grows as wavelength to the power -4
print()
for lam in (0.48, 0.56, 0.66, 0.86):
    print(f"Rayleigh scattering at {lam:.2f} um relative to 0.86 um: {(0.86 / lam) ** 4:5.2f}")

# Two-way transmittance through a clear atmosphere (Beer-Lambert)
tau = {"blue 0.48": 0.20, "red 0.66": 0.06, "NIR 0.86": 0.02}
for sza in (30.0, 60.0):
    mu = math.cos(math.radians(sza))
    for band, t in tau.items():
        T2 = math.exp(-t / mu) * math.exp(-t / 1.0)
print(f"Sun zenith {sza:4.0f} deg {band:9s} optical depth {t:4.2f} two-way transmittance {T2:5.3f}")Sun T = 5778 K Wien peak = 0.50 um Canal water in July T = 295 K Wien peak = 9.82 um Fresh snow T = 268 K Wien peak = 10.81 um Wavelength reflected sunlight emitted by the field (W m-2 sr-1 um-1) 0.48 um 4.9167e+01 3.3765e-35 0.66 um 4.1906e+01 7.4451e-24 0.86 um 2.7743e+01 5.7625e-17 1.60 um 5.6861e+00 6.3634e-07 2.20 um 2.0597e+00 5.2802e-04 3.90 um 2.7667e-01 4.7450e-01 10.90 um 5.6489e-03 8.6555e+00 Rayleigh scattering at 0.48 um relative to 0.86 um: 10.30 Rayleigh scattering at 0.56 um relative to 0.86 um: 5.56 Rayleigh scattering at 0.66 um relative to 0.86 um: 2.88 Rayleigh scattering at 0.86 um relative to 0.86 um: 1.00 Sun zenith 30 deg blue 0.48 optical depth 0.20 two-way transmittance 0.650 Sun zenith 30 deg red 0.66 optical depth 0.06 two-way transmittance 0.879 Sun zenith 30 deg NIR 0.86 optical depth 0.02 two-way transmittance 0.958 Sun zenith 60 deg blue 0.48 optical depth 0.20 two-way transmittance 0.549 Sun zenith 60 deg red 0.66 optical depth 0.06 two-way transmittance 0.835 Sun zenith 60 deg NIR 0.86 optical depth 0.02 two-way transmittance 0.942
The output shows the pattern. In the visible and near infrared the field's emission is negligible, more than 20 orders of magnitude below the reflected signal. At 3.9 µm the two are comparable, so a midwave fire band sees both reflected sunlight and heat; this is why fire detection algorithms compare a 3.9 µm band with a thermal band and treat daytime and night-time images differently. At 10.9 µm emission dominates by a factor of more than a thousand, so a thermal image is a picture of temperature and emissivity, not of reflectance. The Rayleigh ratios explain why the blue band is the most affected by haze, and the transmittances show how much of the signal is lost on the two-way path, more in blue than in near infrared and more when the Sun is low.
What this means for the monitoring program
Leah summarized the physics for the district's board in practical terms. Mapping crops and irrigation needs reflected visible, near infrared and shortwave infrared bands, which means daylight and cloud-free views, and the wettest weeks of June bring the most cloud just when the fields change fastest. Estimating crop water use needs thermal bands, which are coarser and also need clear skies. Watching the coulee banks and mapping floods needs radar, which works through cloud and at night. Smoke from distant wildfires, increasingly common in July and August, raises path radiance and lowers transmittance, so images on smoky days need careful atmospheric correction or must be rejected.
She also pointed out what a satellite cannot do. It measures the top of whatever it sees: the canopy, not the soil beneath it; the surface of the water, not the canal bed; the skin temperature of the top millimeter of a surface, not the temperature of the soil profile. Every product in the program would therefore be checked against field observations by Grant's crew, and its accuracy stated in the same way as the photogrammetric products had been.
Common mistakes
MistakeComparing raw digital numbers from images taken on different dates.
InsteadConvert to radiance and reflectance first; illumination, sensor gain and atmosphere all differ between dates.
MistakeAssuming that a dark target in the blue band is truly dark.
InsteadPath radiance adds a haze signal that is largest in the blue; correct it before interpreting dark water or shadow.
MistakeTreating a thermal image as a map of reflectance.
InsteadThermal radiance depends on temperature and emissivity; reflected sunlight is negligible at 10 µm.
MistakeExpecting optical images of a June flood under cloud.
InsteadUse radar, which sees through cloud, or wait for clear weather.
MistakeConfusing irradiance with radiance.
InsteadIrradiance is flux per area arriving at a surface; radiance is flux per area per solid angle in a direction, the quantity sensors measure.
Summary and key terms
- Remote sensing measures reflected, emitted or scattered electromagnetic radiation to infer surface properties.
- Wavelength and frequency are related by c = λν, and photon energy is E = hν.
- Radiance is the quantity a sensor measures; reflectance describes the surface independently of illumination.
- Planck's law, the Stefan-Boltzmann law and Wien's law describe emission; the Sun peaks near 0.5 µm and the ground near 10 µm.
- Emissivity and Kirchhoff's law link reflectance and emission.
- Rayleigh, Mie and non-selective scattering and gas absorption shape the atmospheric windows in which sensor bands are placed.
- Path radiance, skylight and the adjacency effect add to the signal; Beer-Lambert transmittance reduces it.
- Reflected radiation dominates below about 3 µm and emitted radiation above about 5 µm.
- Radiance
- Radiant flux per unit area per unit solid angle in a given direction, in W m⁻² sr⁻¹.
- Irradiance
- Radiant flux arriving per unit area of a surface, in W m⁻².
- Reflectance
- The ratio of reflected to incident radiant flux at a surface.
- Blackbody
- An ideal surface that absorbs all radiation and emits the maximum possible at every wavelength.
- Emissivity
- The ratio of the radiation emitted by a surface to that emitted by a blackbody at the same temperature.
- Atmospheric window
- A wavelength region in which the atmosphere transmits most radiation.
- Path radiance
- Radiance scattered into the sensor by the atmosphere without reaching the surface.
- Rayleigh scattering
- Scattering by molecules much smaller than the wavelength, varying as the inverse fourth power of wavelength.
Practice problems
Work each problem on paper first, then reveal the answer to check.
What is the frequency of a C-band radar with a wavelength of 5.55 cm?
Show answer
ν = c/λ = 2.998 × 10⁸ / 0.0555 = 5.40 GHz.
What is the energy of a photon at 0.5 µm?
Show answer
E = hc/λ = 6.626 × 10⁻³⁴ × 2.998 × 10⁸ / 0.5 × 10⁻⁶ = 3.97 × 10⁻¹⁹ J.
How much more strongly is light at 0.45 µm scattered by molecules than at 0.90 µm?
Show answer
(0.90/0.45)⁴ = 16 times.
At what wavelength does a grass fire at 900 K emit most strongly?
Show answer
2898 / 900 = 3.2 µm, in the midwave infrared.
A layer has an optical depth of 0.10. What is its direct transmittance for a path 60° from the zenith?
Show answer
e^(−0.10/0.5) = e^(−0.2) = 0.82.
Lesson quiz · 5 questions
Score 60% or more to complete this lesson.
Create a free account to save your progress, take quizzes and earn a certificate.