
DCT-310 · Lesson 10 of 12 · 19 min
Diagnosing hardware failures: logs, LEDs and error codes
Replacing a part is easy once you know which part has failed. Knowing is the hard part. A server that will not boot might have a failed memory module, a failed CPU, a bad riser, a firmware problem or no power at all; a GPU that drops out might be faulty, overheating, short of power or loosely seated. "Guessing is expensive," Roz tells Jamal. "Every part you swap without reason costs the customer money and time, and puts their hardware at risk again. Read what the server is telling you first." This lesson covers how technicians diagnose hardware faults: a step-by-step approach, front-panel LEDs and displays, the BMC event log, POST codes, GPU error codes, and how to tell a hardware fault from something else.
A method for diagnosis
Stonebridge teaches a simple, ordered approach that works for almost any hardware fault:
- Collect: read the ticket, the customer's error messages and the monitoring alerts. Note what changed recently: a repair, a firmware update, a move, a power event.
- Observe: at the rack, look at the LEDs and displays, listen to the fans, feel for heat, and check the cables and power cords. Photograph everything.
- Read the logs: export or read the BMC's event log and health status. Find the first event in time, not just the loudest.
- Narrow down: decide which part, or which shared part, best explains all the symptoms together.
- Act on the cheapest likely fix first, within the customer's authorization: reseat before replace, one change at a time.
- Verify: confirm the fault is gone and the server is healthy, and record what was found and done.
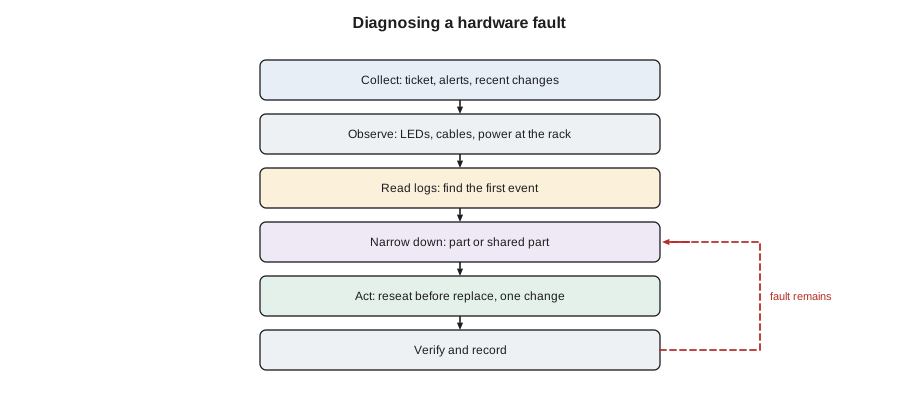
Two habits matter more than any tool. The first is to change one thing at a time. A technician who replaces a memory module, reseats a riser and updates firmware all at once may fix the fault but will not know which change did it, and the next failure will be just as much of a puzzle. The second is to look at what failures have in common. Several drives failing together point at the backplane; several servers in one rack point at the rack's power or airflow; several GPUs in one tray point at the tray's power or cooling.
Front-panel LEDs and displays
Servers communicate their state through a few LEDs on the front and back, and many have a small display or a row of diagnostic LEDs. The patterns vary by vendor and model, so the service guide is the final word, but the common ones are:
| Indicator | Normal | Fault signs |
|---|---|---|
| Power | Solid green when on; amber or off in standby | Off with cords connected: no power reaching the server |
| System health | Solid green or blue | Amber or blinking amber: a component fault, details in the BMC log |
| Identify / locate | Off | Blinking blue: someone has asked for this server to be found |
| Drive status | Green, flickering with activity | Amber: drive failed; blinking amber: predicted failure |
| Power supply | Green | Amber: supply fault; off: no input power |
| Fan module | Off or green | Amber: fan failed |
| Network port | Link light on, activity flashing | Off: no link; wrong color can mean wrong speed |
| BMC heartbeat | Slow steady blink | Off or solid: BMC not running |
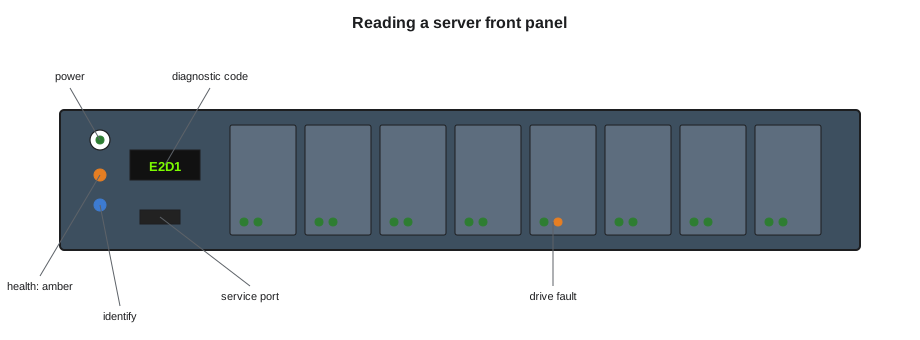
Many servers also show a short code on a small two- or four-character display during boot, or light a pattern of numbered LEDs. These are POST codes, progress markers from the firmware. A server that stops at the same code every time is pointing at the stage that failed: memory training, PCIe initialization, finding a boot device. The vendor's guide lists what each code means.
The BMC event log
The system event log, SEL, in the BMC records hardware events with a timestamp: sensors crossing thresholds, devices failing, power supplies losing input, the system rebooting, firmware errors. It is often the single most useful source in a diagnosis, because it shows the order in which things happened.
# Parsing a system event log (SEL) export to find what happened first
sel = """1 | 11/02/2026 | 02:14:07 | Temperature GPU2 | Upper Non-critical going high | Asserted
2 | 11/02/2026 | 02:14:39 | Temperature GPU2 | Upper Critical going high | Asserted
3 | 11/02/2026 | 02:14:41 | PCIe Slot 2 | Bus Uncorrectable Error | Asserted
4 | 11/02/2026 | 02:14:42 | System Event | OEM GPU2 not detected | Asserted
5 | 11/02/2026 | 02:20:03 | Fan 3 | Lower Critical going low | Asserted"""
events = [dict(zip(["id", "date", "time", "sensor", "event", "state"], [x.strip() for x in line.split("|")])) for line in sel.splitlines()]
print(f"First event: {events[0]['time']} {events[0]['sensor']} - {events[0]['event']}")
for e in events:
    sev = "CRIT" if "Critical" in e["event"] or "Uncorrectable" in e["event"] else "info"
print(f"{e['time']} {sev:4s} {e['sensor']:17s} {e['event']}")First event: 02:14:07 Temperature GPU2 - Upper Non-critical going high 02:14:07 info Temperature GPU2 Upper Non-critical going high 02:14:39 CRIT Temperature GPU2 Upper Critical going high 02:14:41 CRIT PCIe Slot 2 Bus Uncorrectable Error 02:14:42 info System Event OEM GPU2 not detected 02:20:03 CRIT Fan 3 Lower Critical going low
The log above, from a GPU tray, tells a story. First GPU2's temperature crossed its non-critical threshold, then its critical threshold half a minute later. Two seconds after that came a fatal error on its PCIe link, and then the system reported GPU2 not detected: it had fallen off the bus. Six minutes later fan 3 was reported below its critical speed. Reading only the last line, a fan failure, would miss the first sign. Reading all of it suggests that something was overheating GPU2's area before the fan was even flagged, perhaps a fan that was failing slowly, perhaps a cooling problem in the tray. Lesson 12 follows this case to the end.
Event logs have a limited size and old entries roll off, so the log is exported and attached to the ticket as soon as a fault is reported, before anyone clears it or reboots the server. Clearing a log without the customer's permission destroys the evidence the vendor will ask for.
Memory and processor errors
Memory faults are among the most common hardware tickets and have recognizable signs:
- A rising count of corrected errors on one module, reported by the BMC or the operating system, usually means that module is starting to fail. It can be replaced in a planned window.
- An uncorrected error usually crashes the server or the work on it, and the BMC records which module or channel it was on. If it happens once, the customer may run diagnostics; if it repeats, the module is replaced.
- Errors that move between modules in the same channel point at the channel, the socket or the processor rather than the modules.
- A server that does not see some of its memory at boot often has an unseated module, a bent pin in the CPU socket, or modules in slots that break the population rules.
Processor faults are rarer. Machine check errors, recorded by the processor itself, can point at a CPU, but they can also come from memory, PCIe devices or power problems. Replacing a processor is a FRU job, usually done only after the vendor's support has analyzed the logs.
GPU error codes
GPU drivers report errors with numbered codes. NVIDIA's driver, for example, logs Xid errors, each with a number that identifies the kind of event; Xid 79, for instance, is the code for a GPU that has fallen off the bus. Customers' monitoring systems map these codes to actions in their runbooks, and the technician sees the result as a ticket.
# Looking up GPU error codes in the site's runbook table (codes and actions are illustrative)
runbook = {
    13: ("application error", "customer software issue; no hardware action"),
    48: ("double-bit memory error", "drain node; customer resets GPU; repeat -> RMA"),
    63: ("memory row remap recorded", "watch count; no action unless rising"),
    79: ("GPU fell off the bus", "check seating, power and temperature; reseat once; repeat -> RMA"),
    94: ("contained memory error", "customer restarts job; monitor"),
}
for code in (79, 63, 13, 101):
    name, action = runbook.get(code, ("unknown code", "escalate with full log to vendor support"))
print(f"code {code}: {name} -> {action}")code 79: GPU fell off the bus -> check seating, power and temperature; reseat once; repeat -> RMA code 63: memory row remap recorded -> watch count; no action unless rising code 13: application error -> customer software issue; no hardware action code 101: unknown code -> escalate with full log to vendor support
The runbook table above is illustrative, but its structure is typical. Some codes are software problems that need no hardware action at all; some mean "watch and count"; some mean "drain, reseat once, and replace if it repeats". An unknown code is escalated to the vendor with the full logs. The technician's job is not to memorize every code but to follow the runbook and to collect good evidence: the code, the time, the GPU index, the tray serial, the temperatures and power at the time, and what happened when the tray was reseated.
Is it really hardware?
Many problems that arrive as hardware tickets turn out to be something else. Before replacing anything, Jamal asks:
- Is it the environment? A server throttling or shutting down from heat may be fine; the rack's airflow or the hall's cooling may not be (lesson 4, DCT-230).
- Is it power? A server that reboots at random may be on a PDU outlet that is failing, or have both supplies on one feed that is dropping.
- Is it a cable or connector? Optical links with dirty connectors, loose cables after a nearby repair, and pinched internal cables cause faults that look like failed cards.
- Is it firmware? A fault that started on many identical servers after an update is more likely a firmware bug than a wave of hardware failures.
- Is it software? Application errors and driver bugs can look like hardware faults to a user. The customer's administrators decide; the technician supplies the hardware evidence.
The question "what else changed?" is often the fastest route to the answer. The ticket history for the server, the rack and the hall shows recent repairs, moves, firmware waves and power or cooling events.
Diagnostics tools
Vendors provide hardware diagnostics, often built into the firmware or the BMC, that test memory, processors, drives and other parts outside the operating system. Running them usually takes the server out of service for an hour or more, so they are run only when the customer asks. Vendors often require a diagnostics report before they will approve a replacement part (lesson 11). The technician starts the test as the customer's procedure says, records the results, and attaches the report to the ticket.
Worked problem
Random reboots in Hall A
A customer reports that their server in rack A-22-03 has rebooted without warning four times in a week. Their administrators see no software errors and ask Stonebridge to check the hardware.
Show solution
- Collect: the ticket history shows a PDU in that rack was replaced eight days ago.
- Observe: the server's power supply LEDs are both green. Its power cords both run to PDU B. PDU A's cord hangs unplugged behind it.
- Read the logs: the BMC log shows, at each reboot time, both supplies losing input power together for less than a second.
- Narrow down: with both supplies on PDU B, any short dip on feed B reboots the server. The facility's power monitoring shows short dips on that PDU's input matching the times.
- Act: with the customer's approval, move PSU1's cord to PDU A, and raise a facilities ticket for PDU B's input.
- Verify: no reboots in the next two weeks; the electrical team finds and fixes a loose connection feeding PDU B.
Answer: Nothing in the server had failed. Reading the event log, looking at the cords and asking what had changed recently led to a power fault, and to a server that had lost its redundancy during the earlier PDU work.
Common mistakes
MistakeReplacing parts until the fault goes away.
InsteadFind the most likely cause from the evidence and change one thing at a time.
MistakeReading only the most recent log entry.
InsteadFind the first event in time; it is usually nearer the cause.
MistakeClearing the event log before exporting it.
InsteadExport and attach the log first; clear it only with the customer's approval.
MistakeAssuming a hardware ticket is a hardware fault.
InsteadCheck environment, power, cables, firmware and recent changes too.
MistakeTreating LED patterns as the same on every model.
InsteadCheck the vendor's service guide for that model.
Summary and key terms
- Diagnose in order: collect, observe, read logs, narrow down, act one change at a time, verify.
- Look for what several failures have in common: a shared backplane, riser, rack, feed or update.
- Front-panel LEDs, displays and POST codes show the server's state and where boot stopped.
- The BMC event log shows the order of events; export it before anything is cleared or rebooted.
- Memory and GPU errors follow recognizable patterns; runbooks map error codes to actions.
- Many hardware tickets are really environment, power, cable, firmware or software problems.
- POST code
- A progress code from the firmware during the power-on self test.
- SEL
- System event log: the BMC's timestamped record of hardware events.
- Machine check
- An error reported by the processor about a hardware fault.
- Xid error
- A numbered error code logged by NVIDIA's GPU driver.
- Diagnostics
- Vendor tests of hardware run outside the operating system.
- Root cause
- The underlying reason for a fault, as opposed to its symptoms.
Practice problems
Work each problem on paper first, then reveal the answer to check.
Why should you change only one thing at a time?
Show answer
So you know which change fixed the fault, and can learn from it.
A server stops at the same POST code every boot. What does that tell you?
Show answer
Which stage of the firmware's start-up failed, which points at the part involved.
In an event log, why look for the first event rather than the last?
Show answer
The first event is usually closer to the cause; later events are often consequences.
Name two non-hardware causes that can look like a server hardware fault.
Show answer
Any two: high inlet temperature, a power or PDU problem, a dirty or loose cable, a firmware bug, a software or driver problem.
Lesson quiz · 5 questions
Score 60% or more to complete this lesson.
Create a free account to save your progress, take quizzes and earn a certificate.