
STAT-251 · Lesson 7 of 12 · 23 min
Common discrete distributions
A handful of discrete distributions describe an enormous range of situations: the Bernoulli and binomial for successes in a fixed number of trials, the geometric and negative binomial for waiting times measured in trials, the hypergeometric for sampling without replacement, and the Poisson for counts of rare events in time or space. Each arises from a simple story, and knowing the story is the best way to know when the distribution applies. This lesson derives each pmf from its story, computes its mean and variance, proves the relationships between them, and finishes with the Poisson limit theorem, which explains why the Poisson distribution turns up so often in insurance, epidemiology and quality control.
Bernoulli and binomial
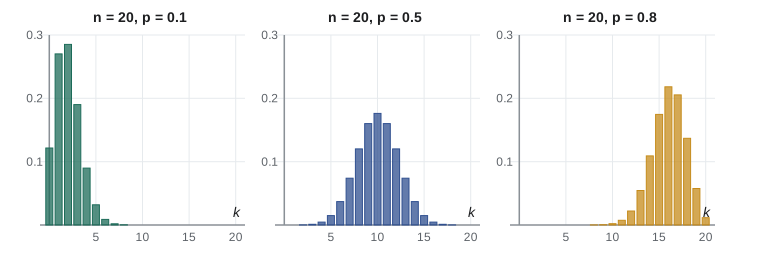
A Bernoulli trial has two outcomes, success with probability \(p\) and failure with probability \(1 - p\). The indicator of success, \(X \sim \text{Bernoulli}(p)\), has \(E[X] = p\) and \(\operatorname{Var}(X) = p - p^2 = p(1 - p)\). The binomial distribution counts successes in \(n\) independent Bernoulli trials with the same \(p\). A particular sequence with \(k\) successes has probability \(p^k(1 - p)^{n - k}\) by independence, and there are \(\binom{n}{k}\) such sequences, so
The probabilities sum to \((p + (1 - p))^n = 1\) by the binomial theorem, which is where the distribution gets its name. Writing \(X\) as a sum of \(n\) independent Bernoulli indicators gives the mean and variance immediately, with no algebra on the pmf: \(E[X] = np\) and \(\operatorname{Var}(X) = np(1 - p)\). The pmf rises while \(P(X = k + 1)/P(X = k) = \frac{(n - k)p}{(k + 1)(1 - p)} > 1\), so its mode is \(\lfloor (n + 1)p \rfloor\). The sum of independent binomials with the same \(p\) is binomial: \(\text{Bin}(m, p) + \text{Bin}(n, p) = \text{Bin}(m + n, p)\), since both count successes in a longer run of trials.
The assumptions matter. The trials must be independent and must share the same \(p\). The number of infected people in a household is not binomial, because infection spreads within households; the number of defectives in a day's production is not binomial if the defect rate drifts during the day. When the assumptions fail, the variance of the count is usually larger than \(np(1 - p)\), a phenomenon called overdispersion.
Geometric and negative binomial
Run independent Bernoulli trials until the first success. The number of trials \(X\) needed is geometric: \(P(X = k) = (1 - p)^{k - 1}p\) for \(k = 1, 2, \ldots\). Its survival function is \(P(X > k) = (1 - p)^k\), the chance that the first \(k\) trials all fail. Using the tail-sum formula of lesson 6, \(E[X] = \sum_{k \ge 0}(1 - p)^k = 1/p\): a die needs on average 6 rolls to show a six. The variance is \((1 - p)/p^2\). Some books count failures before the first success instead, \(Y = X - 1\), with mean \((1 - p)/p\); the weekly claims model of lesson 4 was of this form. The geometric distribution is memoryless, \(P(X > m + n \mid X > m) = P(X > n)\), and is the only memoryless distribution on the positive integers.
The negative binomial generalizes the geometric to the number of trials \(X\) needed for the \(r\)th success. The \(r\)th success happens on trial \(k\) when trial \(k\) is a success and exactly \(r - 1\) of the previous \(k - 1\) are, so
\(X\) is the sum of \(r\) independent geometric waiting times, so \(E[X] = r/p\) and \(\operatorname{Var}(X) = r(1 - p)/p^2\). Actuaries use the negative binomial for claim counts that are more variable than the Poisson allows, and epidemiologists use it for counts of secondary infections, where a few superspreaders cause most of the cases.
Hypergeometric
Draw \(n\) items without replacement from a population of \(N\) containing \(K\) successes. Lesson 2 showed that the number of successes \(X\) has
Write \(X\) as a sum of indicators \(I_1 + \cdots + I_n\), where \(I_j\) indicates that the \(j\)th draw is a success. By symmetry each draw is equally likely to be any item, so \(P(I_j = 1) = K/N\) and \(E[X] = nK/N\), the same as for sampling with replacement. The variance is smaller: with \(p = K/N\), \(\operatorname{Var}(X) = np(1 - p)\frac{N - n}{N - 1}\). The factor \((N - n)/(N - 1)\), the finite population correction, reflects the negative dependence between draws: drawing a success makes the next draw slightly less likely to be one. Lesson 9 derives it from covariances. When \(n\) is a small fraction of \(N\) the correction is close to 1 and the binomial is an excellent approximation.
Poisson
\(X\) is Poisson with mean \(\lambda > 0\) if
The probabilities sum to 1 because \(\sum \lambda^k/k! = e^\lambda\). For the mean, \(E[X] = \sum_{k \ge 1} k e^{-\lambda}\lambda^k/k! = \lambda\sum_{k \ge 1}e^{-\lambda}\lambda^{k-1}/(k-1)! = \lambda\). A similar shift computes \(E[X(X - 1)] = \lambda^2\), so \(E[X^2] = \lambda^2 + \lambda\) and \(\operatorname{Var}(X) = \lambda\). Mean equals variance is the Poisson signature, and comparing the two in data is the first check of whether a Poisson model is reasonable.
The sum of independent Poisson variables is Poisson: if \(X \sim \text{Poisson}(\lambda)\) and \(Y \sim \text{Poisson}(\mu)\) are independent, the convolution gives \(P(X + Y = n) = \sum_k e^{-\lambda}\frac{\lambda^k}{k!}e^{-\mu}\frac{\mu^{n-k}}{(n-k)!} = \frac{e^{-(\lambda + \mu)}}{n!}\sum_k\binom{n}{k}\lambda^k\mu^{n-k} = e^{-(\lambda+\mu)}\frac{(\lambda + \mu)^n}{n!}\). So claims from two independent regions, each Poisson, total to a Poisson count with the combined mean. Conversely, if each of a Poisson number of events is independently of type A with probability \(q\), the type A count is Poisson with mean \(\lambda q\) and independent of the type B count. This thinning property lets an insurer split a Poisson stream of claims into small and large ones and model each separately.
The Poisson limit theorem
Why is the Poisson so common? Because it is the limit of the binomial when there are many trials, each with a small chance of success. Let \(X_n \sim \text{Bin}(n, p_n)\) with \(np_n \to \lambda\). For fixed \(k\),
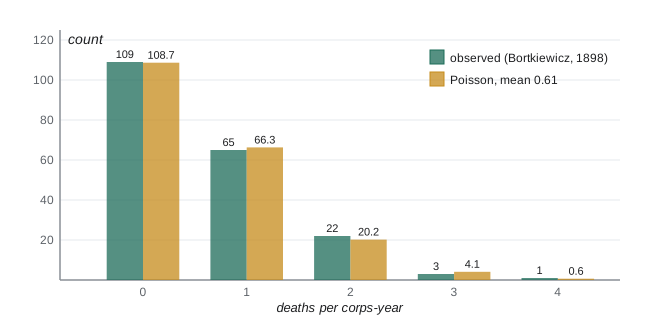
As \(n \to \infty\) the first factor tends to \(\lambda^k/k!\), the second to 1, the third to \(e^{-\lambda}\) because \((1 - \lambda/n)^n \to e^{-\lambda}\), and the fourth to 1. So \(P(X_n = k) \to e^{-\lambda}\lambda^k/k!\). The theorem explains why the number of claims on a large portfolio of independent policies, the number of typos on a page, the number of mutations in a stretch of DNA and the number of calls to a help line in a minute are all approximately Poisson: each is a count of many unlikely, roughly independent events. The classical example, analysed by Ladislaus Bortkiewicz in 1898, was the number of Prussian cavalry soldiers killed each year by horse kicks, which fit a Poisson distribution with mean about 0.61 remarkably well.
The approximation is good when \(n\) is large and \(p\) small; a rule of thumb is \(n \ge 20\) and \(p \le 0.05\). Le Cam's inequality makes it precise: the total variation distance between \(\text{Bin}(n, p)\) and \(\text{Poisson}(np)\) is at most \(np^2\), and the bound extends to sums of independent Bernoulli trials with different probabilities \(p_i\), where it becomes \(\sum p_i^2\). That generalization is what really justifies Poisson models for insurance portfolios whose policies have different risks.
Worked problem
Rare adverse events
A vaccine causes a serious reaction in 1 of every 50,000 doses. A province gives 200,000 doses. Find the probability of at least one serious reaction and of more than 6.
Show solution
- The count is \(\text{Bin}(200{,}000, 1/50{,}000)\), approximately Poisson with \(\lambda = 4\).
- \(P(X \ge 1) = 1 - e^{-4} \approx 0.982\).
- \(P(X \le 6) = e^{-4}(1 + 4 + 8 + 10.67 + 10.67 + 8.53 + 5.69) \approx 0.889\), so \(P(X > 6) \approx 0.111\).
- Le Cam’s bound on the approximation error is \(np^2 = 200{,}000/50{,}000^2 = 0.00008\), far below the precision we need.
Answer: At least one reaction is nearly certain (about 0.98), and more than six happens about 11% of the time even when the true rate is unchanged. Safety monitors use exactly this calculation to decide when a cluster of reports is surprising.
from math import comb, exp, factorial
import random

def binom_pmf(k, n, p):  return comb(n, k) * p**k * (1 - p)**(n - k)
def pois_pmf(k, lam):     return exp(-lam) * lam**k / factorial(k)
def hyper_pmf(k, N, K, n): return comb(K, k) * comb(N - K, n - k) / comb(N, n)

print(" k   Bin(200000,2e-5)  Poisson(4)")
for k in range(0, 9):
    print(f"{k:2d}   {binom_pmf(k, 200_000, 2e-5):.6f}        {pois_pmf(k, 4):.6f}")
tv = 0.5 * sum(abs(binom_pmf(k, 200_000, 2e-5) - pois_pmf(k, 4)) for k in range(60))
print(f"total variation distance {tv:.2e}  (Le Cam bound {200_000 * 2e-5**2:.1e})")

# hypergeometric vs binomial: sample 10 from 60 items with 12 defective
for k in range(0, 5):
    print(f"k = {k}: hypergeometric {hyper_pmf(k, 60, 12, 10):.4f}  binomial {binom_pmf(k, 10, 0.2):.4f}")

# Poisson signature: simulated mean and variance; thinning
rng = random.Random(251)
def poisson(lam):              # count unit-rate exponential arrivals before time lam
    t, k = 0.0, -1
    while t <= lam:
        t += rng.expovariate(1.0); k += 1
    return k
xs = [poisson(4) for _ in range(100_000)]
m = sum(xs) / len(xs); v = sum((x - m) ** 2 for x in xs) / len(xs)
large = [sum(rng.random() < 0.25 for _ in range(x)) for x in xs[:50_000]]
ml = sum(large) / len(large)
print(f"Poisson(4) sample mean {m:.3f}, variance {v:.3f}; thinned mean {ml:.3f} (expected 1.000)")k Bin(200000,2e-5) Poisson(4) 0 0.018315 0.018316 1 0.073261 0.073263 2 0.146524 0.146525 3 0.195368 0.195367 4 0.195369 0.195367 5 0.156295 0.156293 6 0.104196 0.104196 7 0.059540 0.059540 8 0.029770 0.029770 total variation distance 5.01e-06 (Le Cam bound 8.0e-05) k = 0: hypergeometric 0.0868 binomial 0.1074 k = 1: hypergeometric 0.2669 binomial 0.2684 k = 2: hypergeometric 0.3303 binomial 0.3020 k = 3: hypergeometric 0.2148 binomial 0.2013 k = 4: hypergeometric 0.0806 binomial 0.0881 Poisson(4) sample mean 3.994, variance 3.998; thinned mean 0.999 (expected 1.000)
Choosing a discrete model
The stories decide the model. A fixed number of independent trials with the same success probability gives the binomial. Waiting for the first or \(r\)th success gives the geometric or negative binomial. Sampling without replacement from a finite population gives the hypergeometric. Counting rare events in a period of time or a region of space, when events occur independently at a steady rate, gives the Poisson. Data can then check the choice. If counts have variance much larger than their mean, a Poisson model understates risk, and an insurer that priced on it would set aside too little for bad years; the negative binomial, which arises as a Poisson whose mean is itself random, is the usual remedy.
A historical data set: deaths from horse kicks
The horse-kick data mentioned above come from Ladislaus von Bortkiewicz's book Das Gesetz der kleinen Zahlen (The Law of Small Numbers), published in 1898. He recorded the number of soldiers killed by horse kicks in 10 Prussian cavalry corps over 20 years, from 1875 to 1894, giving 200 corps-years. In 109 corps-years there were no deaths, in 65 one death, in 22 two, in 3 three and in 1 four. The total is \(65 + 44 + 9 + 4 = 122\) deaths, so the average is \(\hat{\lambda} = 122/200 = 0.61\) per corps-year.
If deaths in a corps-year are Poisson with mean 0.61, the expected number of corps-years with \(k\) deaths is \(200e^{-0.61}0.61^k/k!\). Since \(e^{-0.61} \approx 0.5434\), this gives about 108.7, 66.3, 20.2, 4.1 and 0.6 for \(k = 0, 1, 2, 3, 4\). The agreement with the observed counts is striking, and the reason is the Poisson limit theorem: each soldier had a tiny, roughly independent chance of a fatal kick in a year, and there were many soldiers. The sample variance of the counts is also close to the mean, as the Poisson model requires: \(\frac{1}{200}(65 + 88 + 27 + 16) - 0.61^2 = 0.98 - 0.3721 = 0.6079\). A variance well above the mean (overdispersion) would suggest that the rate differs between corps or years, and a model such as the negative binomial would fit better.
The same reasoning applies to modern counts of rare events spread over many independent opportunities: misprints per page, goals per hockey game, calls per minute to a help line, and mutations per generation. When counts are much more variable than the Poisson model allows, the clustering itself is informative; insurance claims after a storm, for example, arrive together rather than independently.
Common mistakes
MistakeUsing the binomial when trials are dependent or have different success probabilities.
InsteadCheck independence and constant \(p\); clustered or drifting data are overdispersed.
MistakeUsing the binomial for draws without replacement from a small population.
InsteadUse the hypergeometric, or include the finite population correction \((N - n)/(N - 1)\).
MistakeMixing up the two geometric conventions.
InsteadTrials until the first success has mean \(1/p\); failures before it has mean \((1 - p)/p\).
MistakeApplying the Poisson approximation when \(p\) is not small.
InsteadIts error is at most \(np^2\); for \(p = 0.3\) use the binomial or a normal approximation instead.
MistakeThinking the Poisson variance can differ from its mean.
InsteadFor a Poisson model they are equal; a big gap in data means the model is wrong.
Summary and key terms
- Binomial: successes in \(n\) independent trials, mean \(np\), variance \(np(1 - p)\).
- Geometric: trials until the first success, mean \(1/p\), memoryless; negative binomial: trials until the \(r\)th success, mean \(r/p\).
- Hypergeometric: sampling without replacement, mean \(nK/N\), variance reduced by \((N - n)/(N - 1)\).
- Poisson: \(e^{-\lambda}\lambda^k/k!\), mean and variance both \(\lambda\); independent Poissons add and thinned Poissons stay Poisson.
- The binomial with large \(n\) and small \(p\) is close to Poisson with \(\lambda = np\), within \(np^2\) in total variation.
- Bernoulli trial
- An experiment with two outcomes, success and failure.
- binomial distribution
- The number of successes in a fixed number of independent Bernoulli trials.
- geometric distribution
- The number of trials until the first success.
- negative binomial distribution
- The number of trials until the \(r\)th success.
- hypergeometric distribution
- The number of successes in a sample drawn without replacement.
- Poisson distribution
- \(P(X = k) = e^{-\lambda}\lambda^k/k!\).
- overdispersion
- Variance larger than the model allows, often from dependence or varying rates.
- thinning
- Keeping each event of a Poisson stream independently with a fixed probability.
Practice problems
Work each problem on paper first, then reveal the answer to check.
A multiple-choice test has 20 questions with 4 options each. A student guesses every one. Find the mean and standard deviation of the score and \(P(\text{score} \ge 10)\).
Show answer
Mean 5, standard deviation \(\sqrt{20 \times 0.25 \times 0.75} \approx 1.94\); \(P(X \ge 10) = \sum_{k \ge 10}\binom{20}{k}0.25^k0.75^{20-k} \approx 0.0139\).
Prove that \(E[X(X - 1)] = \lambda^2\) for a Poisson variable.
Show answer
\(\sum_{k \ge 2}k(k-1)e^{-\lambda}\lambda^k/k! = \lambda^2\sum_{k \ge 2}e^{-\lambda}\lambda^{k-2}/(k-2)! = \lambda^2\).
A basketball player makes 70% of free throws. Find the probability her third miss comes on her tenth attempt.
Show answer
Negative binomial with misses as successes, \(p = 0.3\), \(r = 3\): \(\binom{9}{2}0.3^3 0.7^7 \approx 0.080\).
An emergency department sees on average 3 patients an hour overnight. Find the probability of no patients in a given hour, and of at most 2 in two hours.
Show answer
\(e^{-3} \approx 0.050\); in two hours the count is Poisson(6), so \(P(\le 2) = e^{-6}(1 + 6 + 18) \approx 0.062\).
Show that if \(X\) is geometric then \(P(X > m + n \mid X > m) = P(X > n)\).
Show answer
\((1 - p)^{m + n}/(1 - p)^m = (1 - p)^n\).
Twelve of 60 parts are defective and 10 are sampled without replacement. Find the variance of the number of defectives and compare with the binomial.
Show answer
\(10 \times 0.2 \times 0.8 \times 50/59 \approx 1.356\), against 1.6 for the binomial.
Lesson quiz · 5 questions
Score 60% or more to complete this lesson.
Create a free account to save your progress, take quizzes and earn a certificate.