
STAT-251 · Lesson 11 of 12 · 28 min
The law of large numbers and the central limit theorem
Two theorems explain why probability works in practice. The law of large numbers says that the average of many independent repetitions settles down to the expected value, which is why a casino, an insurer and a pollster can rely on long-run averages even though each individual outcome is unpredictable. The central limit theorem says more: the fluctuations of the average around its expected value are approximately normal, whatever the distribution of the individual terms, with a size that shrinks like \(1/\sqrt{n}\). Together they justify confidence intervals, margins of error, quality control charts and most of statistical inference. This lesson proves the weak law from Chebyshev's inequality, states the central limit theorem and sketches its proof with moment generating functions, and puts both to work with the normal approximation to the binomial and the continuity correction.
The sample mean
Let \(X_1, X_2, \dots\) be independent and identically distributed (i.i.d.) with mean \(\mu\) and variance \(\sigma^2\), and let \(\bar{X}_n = (X_1 + \cdots + X_n)/n\). By linearity \(E[\bar{X}_n] = \mu\), and because variances of independent terms add, \(\operatorname{Var}(\bar{X}_n) = n\sigma^2/n^2 = \sigma^2/n\). The standard deviation of the average, \(\sigma/\sqrt{n}\), is called the standard error. These two lines contain the core of everything that follows: the average is centred on the right value, and its spread shrinks with \(\sqrt{n}\). Quadrupling the sample halves the standard error, which is why polls of 1,000 and 4,000 people differ in precision by a factor of two, not four.
Markov's and Chebyshev's inequalities
Two inequalities bound tail probabilities using only a mean or a variance. Markov's inequality: if \(X \ge 0\) and \(a > 0\), then \(P(X \ge a) \le E[X]/a\). Proof: \(X \ge a\mathbf{1}\{X \ge a\}\) pointwise, and taking expectations gives \(E[X] \ge aP(X \ge a)\). Applying Markov to the non-negative variable \((X - \mu)^2\) with \(a = k^2\) gives Chebyshev's inequality:
Chebyshev's inequality holds for every distribution with a finite variance, so it is often crude: it says that at most 25% of any distribution lies two or more standard deviations from the mean, where the normal value is about 4.6%. Its value lies in its generality. The inequality is named after Pafnuty Chebyshev, who published it in 1867; Irénée-Jules Bienaymé had stated it earlier, in 1853, and it is sometimes called the Bienaymé–Chebyshev inequality.
The weak law of large numbers
Apply Chebyshev to \(\bar{X}_n\), which has mean \(\mu\) and variance \(\sigma^2/n\). For any \(\varepsilon > 0\),
This is the weak law of large numbers: the sample mean converges in probability to \(\mu\). The first version, for Bernoulli trials, is due to Jacob Bernoulli, whose Ars Conjectandi was published posthumously in 1713. His proof was much longer, because the variance tools above did not yet exist. The strong law of large numbers, proved in full generality by Kolmogorov in the 1930s, says more: with probability 1, the sequence \(\bar{X}_n\) actually converges to \(\mu\). The weak law says that for each large \(n\), a big deviation is unlikely; the strong law says that, along almost every infinite sequence of outcomes, the deviations eventually stay small forever. Both need only a finite mean for i.i.d. sequences, though our proof used a finite variance.
The law of large numbers is often misread as a force that corrects past deviations. It is not. After ten heads in a row, a fair coin is still fair; the proportion of heads returns towards one half because the initial excess of ten is swamped by thousands of later tosses, not because tails become more likely. The belief that a run of heads makes tails due is the gambler's fallacy. In 1913, at the Monte Carlo casino, black came up 26 times in a row at roulette, and gamblers lost heavily betting on red.
Worked problem
How many simulations?
A Monte Carlo study estimates a probability \(p\) by the proportion \(\hat{p}\) of \(n\) independent trials in which an event occurs. How large must \(n\) be to guarantee \(P(|\hat{p} - p| \ge 0.01) \le 0.05\) using Chebyshev, and how large using the normal approximation?
Show solution
- Each trial is Bernoulli(\(p\)) with variance \(p(1 - p) \le 1/4\). Chebyshev gives \(P(|\hat{p} - p| \ge 0.01) \le \frac{1/4}{n(0.0001)} = \frac{2500}{n}\).
- Setting \(2500/n \le 0.05\) gives \(n \ge 50{,}000\).
- The CLT, from the next section, gives \(P(|\hat{p} - p| \ge 0.01) \approx P(|Z| \ge 0.01\sqrt{n}/0.5)\), which equals 0.05 when \(0.02\sqrt{n} = 1.96\), that is \(n \approx 9604\).
Answer: Chebyshev guarantees accuracy with 50,000 trials; the normal approximation says about 9,600 suffice. The guarantee is conservative because it holds for every distribution.
The central limit theorem
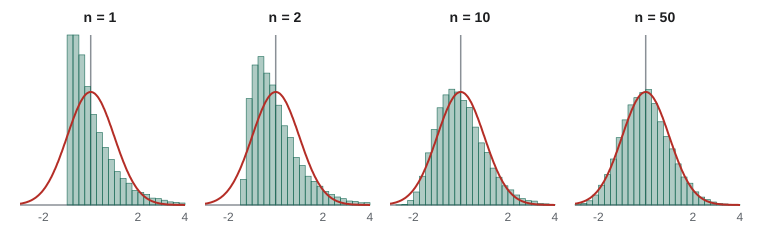
The law of large numbers tells us that \(\bar{X}_n - \mu \to 0\). The central limit theorem (CLT) tells us the shape of the deviation when it is magnified by \(\sqrt{n}\). With i.i.d. terms of mean \(\mu\) and finite variance \(\sigma^2 > 0\), let \(S_n = X_1 + \cdots + X_n\). Then for every real \(z\),
In words: a sum of many independent, identically distributed terms is approximately normal with mean \(n\mu\) and variance \(n\sigma^2\), and the average is approximately \(N(\mu, \sigma^2/n)\). The remarkable part is that the shape of the terms does not matter. They can be dice, coin tosses, exponential waiting times or claim sizes. Only the mean and variance survive in the limit. This is why the normal distribution appears whenever a quantity is the accumulated effect of many small, roughly independent influences, from measurement errors to heights.
A sketch of the proof
The MGF method gives a short proof when the MGF of the terms exists near 0. Standardize: let \(Y_i = (X_i - \mu)/\sigma\), which have mean 0 and variance 1, and let \(Z_n = (Y_1 + \cdots + Y_n)/\sqrt{n}\). By independence and the scaling rule,
Expand \(M_Y\) near 0 using its moments: \(M_Y(s) = 1 + E[Y]s + E[Y^2]s^2/2 + o(s^2) = 1 + s^2/2 + o(s^2)\). With \(s = t/\sqrt{n}\), \(M_{Z_n}(t) = \big(1 + \frac{t^2}{2n} + o(1/n)\big)^n \to e^{t^2/2}\), using the limit \((1 + a/n + o(1/n))^n \to e^a\). The limit is the MGF of the standard normal. A continuity theorem (if MGFs converge on an interval around 0, the cdfs converge at every point) completes the argument. The general proof, which needs only a finite variance, is the same argument with characteristic functions, which always exist. Look at where the hypotheses were used: the mean zero killed the linear term, the variance one fixed the quadratic term, and the higher moments disappeared in the limit. That is why only \(\mu\) and \(\sigma^2\) survive.
History
Abraham de Moivre found the first case in 1733, for the binomial distribution with \(p = 1/2\), while approximating sums of binomial coefficients; he used what is now called Stirling's formula and obtained the normal curve as the limit. He included the result in the second edition of The Doctrine of Chances (1738). Pierre-Simon Laplace extended it to general \(p\) and to sums of other variables, in work culminating in his Théorie analytique des probabilités (1812), so the binomial case is now called the de Moivre–Laplace theorem. A rigorous proof under general conditions was given by Aleksandr Lyapunov in 1901, and Jarl Lindeberg in 1922 and Paul Lévy found the conditions now taught. The name central limit theorem was coined by George Pólya in 1920, central in the sense of being of central importance.
The normal approximation to the binomial
A Binomial(\(n, p\)) count is a sum of \(n\) independent Bernoulli(\(p\)) terms, so for large \(n\) it is approximately \(N(np, np(1 - p))\). A common rule of thumb asks for \(np \ge 10\) and \(n(1 - p) \ge 10\); the approximation is poor for very skewed binomials, where the Poisson approximation is better. Because the binomial takes integer values and the normal is continuous, the approximation improves with the continuity correction: treat the integer \(k\) as the interval \([k - 0.5, k + 0.5]\). So \(P(X \le k) \approx \Phi\big(\frac{k + 0.5 - np}{\sqrt{np(1-p)}}\big)\) and \(P(X \ge k) \approx 1 - \Phi\big(\frac{k - 0.5 - np}{\sqrt{np(1-p)}}\big)\).
Worked problem
Flight overbooking
An airline sells 200 tickets for a flight with 190 seats. Each passenger independently shows up with probability 0.92. Approximate the probability that more passengers show up than there are seats.
Show solution
- Let \(X \sim \text{Bin}(200, 0.92)\). Then \(np = 184\) and \(np(1 - p) = 14.72\), so the standard deviation is about 3.837.
- We need \(P(X \ge 191)\). With the continuity correction, \(P(X \ge 191) \approx P(Z \ge (190.5 - 184)/3.837) = P(Z \ge 1.694)\).
- \(1 - \Phi(1.694) \approx 0.045\). The exact binomial value, computed in the code below, is about 0.037; the skewness of the binomial with \(p\) near 1 accounts for the small difference.
Answer: About a 4% chance of an overbooked flight (3.7% exactly).
Worked problem
Margin of error of a poll
A poll of 1,000 randomly chosen voters finds 52% support for a proposal. Find an approximate 95% interval for the true proportion.
Show solution
- The sample proportion \(\hat{p}\) is approximately normal with mean \(p\) and standard deviation \(\sqrt{p(1-p)/n}\), which we estimate by \(\sqrt{0.52 \times 0.48/1000} \approx 0.0158\).
- With probability about 0.95, \(|\hat{p} - p| \le 1.96 \times 0.0158 \approx 0.031\).
Answer: Roughly \(52\% \pm 3.1\%\), the familiar "margin of error of about 3 percentage points, 19 times out of 20" reported with Canadian polls. The margin assumes a random sample; it does not cover biased sampling or wording effects.
Sums with the CLT
The CLT applies to any sum of many independent terms, not just counts. Suppose an insurer's 10,000 home policies have independent annual losses with a mean of 650 dollars and a standard deviation of 4,000 dollars (most policies claim nothing, a few claim a lot). The total loss has mean 6.5 million dollars and standard deviation \(4000\sqrt{10000} = 400{,}000\). The probability that total losses exceed 7.3 million, two standard deviations above the mean, is about \(1 - \Phi(2) \approx 0.023\). The relative variability of the total, \(400{,}000/6{,}500{,}000 \approx 6\%\), is far smaller than that of a single policy, whose standard deviation is six times its mean. This is the law of large numbers and the CLT at work in the business of insurance. The calculation assumes independence; a single hailstorm over Calgary, which can cause over a billion dollars of insured damage, violates it, which is why insurers buy reinsurance.
When the CLT fails or is slow
The theorem needs a finite variance. The Cauchy distribution, the ratio of two independent standard normals, has no mean at all, and the average of \(n\) Cauchy variables has exactly the same Cauchy distribution as a single one: averaging does not help. Heavy-tailed data such as earthquake energies, city sizes and some financial losses can behave similarly. Even with a finite variance, the approximation can be slow for skewed terms. The Berry–Esseen theorem quantifies this: the maximum error in the cdf is at most \(C\rho/(\sigma^3\sqrt{n})\), where \(\rho = E|X - \mu|^3\) and \(C\) is a constant below 0.48. So skewness slows convergence, and the error shrinks like \(1/\sqrt{n}\). Dependence also matters: positively correlated terms make the sum more variable than \(\sigma\sqrt{n}\) suggests.
import random, math
from statistics import mean, pstdev, NormalDist

rng = random.Random(251)
Phi = NormalDist().cdf

# law of large numbers: running proportion of sixes
sixes, checkpoints = 0, {10, 100, 1000, 10_000, 100_000}
for n in range(1, 100_001):
    sixes += rng.randint(1, 6) == 6
    if n in checkpoints:
        print(f"n = {n:>6}: proportion of sixes {sixes / n:.4f}  (1/6 = {1/6:.4f})")

# CLT: standardized mean of n exponential(1) variables
for n in (1, 2, 10, 50):
    zs = [(mean(rng.expovariate(1) for _ in range(n)) - 1) * math.sqrt(n) for _ in range(20_000)]
    print(f"n = {n:>2}: P(Z <= -1) = {sum(z <= -1 for z in zs) / len(zs):.4f}, "
          f"P(Z > 1.645) = {sum(z > 1.645 for z in zs) / len(zs):.4f}  (normal: 0.1587, 0.0500)")

# overbooking: exact binomial against the normal approximation
n, p = 200, 0.92
exact = sum(math.comb(n, k) * p ** k * (1 - p) ** (n - k) for k in range(191, n + 1))
mu, sd = n * p, math.sqrt(n * p * (1 - p))
print(f"P(X >= 191): exact {exact:.4f}, with continuity correction {1 - Phi((190.5 - mu) / sd):.4f}, "
      f"without {1 - Phi((191 - mu) / sd):.4f}")

# Chebyshev against the truth for a normal variable
for k in (1.5, 2, 3):
    print(f"k = {k}: Chebyshev bound {1 / k ** 2:.3f}, normal value {2 * (1 - Phi(k)):.4f}")

# the Cauchy distribution: averaging does not help
for n in (1, 100, 10_000):
    means = [mean(rng.gauss(0, 1) / rng.gauss(0, 1) for _ in range(n)) for _ in range(200)]
print(f"Cauchy, n = {n:>5}: share of means with |mean| > 3 = {sum(abs(m) > 3 for m in means) / 200:.3f}")n = 10: proportion of sixes 0.3000 (1/6 = 0.1667) n = 100: proportion of sixes 0.1500 (1/6 = 0.1667) n = 1000: proportion of sixes 0.1690 (1/6 = 0.1667) n = 10000: proportion of sixes 0.1672 (1/6 = 0.1667) n = 100000: proportion of sixes 0.1663 (1/6 = 0.1667) n = 1: P(Z <= -1) = 0.0000, P(Z > 1.645) = 0.0729 (normal: 0.1587, 0.0500) n = 2: P(Z <= -1) = 0.1159, P(Z > 1.645) = 0.0724 (normal: 0.1587, 0.0500) n = 10: P(Z <= -1) = 0.1562, P(Z > 1.645) = 0.0631 (normal: 0.1587, 0.0500) n = 50: P(Z <= -1) = 0.1546, P(Z > 1.645) = 0.0554 (normal: 0.1587, 0.0500) P(X >= 191): exact 0.0374, with continuity correction 0.0451, without 0.0340 k = 1.5: Chebyshev bound 0.444, normal value 0.1336 k = 2: Chebyshev bound 0.250, normal value 0.0455 k = 3: Chebyshev bound 0.111, normal value 0.0027 Cauchy, n = 1: share of means with |mean| > 3 = 0.180 Cauchy, n = 100: share of means with |mean| > 3 = 0.190 Cauchy, n = 10000: share of means with |mean| > 3 = 0.155
Common mistakes
MistakeBelieving that the law of large numbers makes outcomes compensate for past runs.
InsteadIndependent trials have no memory; early deviations are diluted, not corrected.
MistakeUsing \(\sigma\sqrt{n}\) for the standard deviation of the average.
InsteadThe sum has standard deviation \(\sigma\sqrt{n}\); the average has \(\sigma/\sqrt{n}\).
MistakeThinking the CLT says the data become normal.
InsteadIndividual observations keep their distribution; it is the sum or average that becomes approximately normal.
MistakeSkipping the continuity correction for small or moderate \(n\).
InsteadTreat the integer \(k\) as \([k - 0.5, k + 0.5]\).
MistakeApplying the CLT to heavy-tailed or dependent data without checking.
InsteadThe theorem needs finite variance, and dependence changes the variance of the sum.
Summary and key terms
- The sample mean has mean \(\mu\) and standard error \(\sigma/\sqrt{n}\).
- Markov: \(P(X \ge a) \le E[X]/a\) for \(X \ge 0\). Chebyshev: \(P(|X - \mu| \ge k) \le \sigma^2/k^2\).
- Weak law of large numbers: \(\bar{X}_n \to \mu\) in probability, by Chebyshev. The strong law gives convergence with probability 1.
- Central limit theorem: \((\bar{X}_n - \mu)/(\sigma/\sqrt{n})\) tends to \(N(0, 1)\) for i.i.d. terms with finite variance.
- The MGF proof shows why only the mean and the variance survive in the limit.
- Binomial counts are approximately normal for large \(np\) and \(n(1 - p)\); use the continuity correction.
- The CLT can fail for infinite-variance data and converges slowly for skewed data.
- i.i.d.
- Independent and identically distributed.
- standard error
- The standard deviation of an estimator; \(\sigma/\sqrt{n}\) for a sample mean.
- Chebyshev's inequality
- \(P(|X - \mu| \ge k) \le \sigma^2/k^2\).
- convergence in probability
- \(P(|Y_n - c| \ge \varepsilon) \to 0\) for every \(\varepsilon > 0\).
- convergence in distribution
- Convergence of cdfs at every continuity point of the limit.
- central limit theorem
- The standardized sum of i.i.d. finite-variance terms tends to a standard normal.
- continuity correction
- Widening each integer value by one half when approximating a discrete count by a normal.
- gambler's fallacy
- The false belief that independent outcomes balance out in the short run.
Practice problems
Work each problem on paper first, then reveal the answer to check.
The number of daily website visits has mean 500 and standard deviation 50. Use Chebyshev to bound the probability that a day has fewer than 400 or more than 600 visits.
Show answer
\(k = 100\), so at most \(2500/10000 = 0.25\).
Find the approximate probability that the total of 100 fair dice exceeds 380.
Show answer
Mean 350, variance \(100 \times 35/12\), sd about 17.08. With continuity correction \(P(Z > 30.5/17.08) = P(Z > 1.79) \approx 0.037\).
How large a poll is needed for a 95% margin of error of 2 percentage points?
Show answer
\(1.96\sqrt{0.25/n} = 0.02\) gives \(n \approx 2401\).
A fair coin is tossed 400 times. Approximate \(P(\text{heads} \ge 220)\).
Show answer
Mean 200, sd 10. \(P(Z \ge 19.5/10) = P(Z \ge 1.95) \approx 0.026\).
Show that the Markov bound is attained when \(X\) takes only the values 0 and \(a\).
Show answer
Then \(E[X] = aP(X = a)\), so \(P(X \ge a) = E[X]/a\) exactly.
Explain why the CLT cannot apply to a sum of Cauchy variables.
Show answer
The Cauchy distribution has no finite variance (or mean), and its averages remain Cauchy.
Lesson quiz · 5 questions
Score 60% or more to complete this lesson.
Create a free account to save your progress, take quizzes and earn a certificate.