
NUC-200 · Lesson 1 of 12 · 22 min
Nuclear energy in the energy system
Hana Okoye started at Meridian Nuclear Engineering in Oshawa three weeks after finishing her engineering degree. The firm does engineering and analysis for utilities and suppliers, and its biggest client this year is Ontario Power Generation (OPG), which is building small modular reactors (SMRs) at Darlington. Hana's first assignment is not a calculation. She has to help prepare answers for a public information session, where residents, teachers, students and business owners will ask what the new reactors are for, whether they are safe, what happens to the waste and what they will cost. Her mentor, Dr. Paul Brennan, a reactor physicist with thirty years in the industry, hands her a list of questions collected at earlier meetings. This course follows Hana as she works through that list, one question per lesson, and builds the engineering understanding a new nuclear engineer needs.
The first question on the list is the broadest: why build nuclear plants at all? Answering it well means understanding the electricity system as a whole, how different sources behave, what they cost, what they emit and how they fit together. Nuclear engineering does not exist in isolation. A reactor is valuable only because of what it adds to a grid that also contains hydro dams, gas turbines, wind farms, solar panels, batteries and transmission lines, and engineers who work on reactors need to speak the language of the whole system.
How much electricity, and why demand is rising
Electricity demand in most developed countries was nearly flat for two decades after about 2005, as efficiency gains in lighting, motors and appliances offset growth in population and the economy. That pattern has ended. Demand forecasts in both Canada and the United States now show steady growth through the 2030s and 2040s, driven by three forces. The first is electrification: heat pumps replacing furnaces, electric vehicles replacing gasoline cars, and electric boilers and furnaces in industry. The second is new industrial load, including battery plants, mines and hydrogen production. The third is data centres, which have become one of the fastest-growing sources of demand anywhere in North America.
In Ontario, the province's electricity system operator has projected that demand could grow by roughly three quarters between the mid-2020s and 2050. Much of the existing supply was built decades ago and will need replacement or refurbishment over the same period. Canada as a whole already has one of the cleanest grids in the world, because hydroelectricity supplies well over half of the country's electricity, but the hydro resource is concentrated in a few provinces. Ontario relies on nuclear for about half of its electricity, and Alberta, Saskatchewan and Nova Scotia still burn significant amounts of fossil fuel.
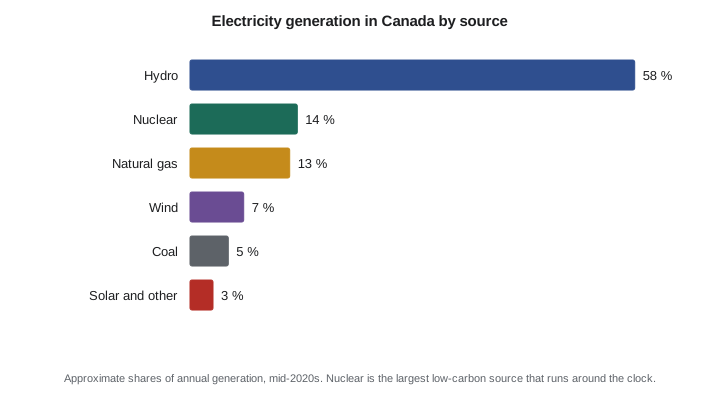
Power, energy and capacity factor
Two quantities are easy to confuse and essential to keep apart. Power is the rate of producing energy, measured in watts. A plant's capacity is its maximum power output, usually quoted in megawatts (MW) or gigawatts (GW). Energy is power multiplied by time, measured in watt-hours; grid energy is usually counted in megawatt-hours (MWh), gigawatt-hours (GWh) or terawatt-hours (TWh). A 300 MW plant running flat out for one hour produces 300 MWh. A household uses roughly 7 to 11 MWh per year, depending on its size, climate and heating.
No plant runs at full output every hour of the year. The capacity factor is the energy a plant actually produces in a year divided by the energy it would produce at full capacity for all 8760 hours. It reflects how often the energy source is available, how often the plant is shut down for maintenance or refuelling, and how often the grid operator asks it to reduce output. Capacity factor is the main reason that comparing plants by their nameplate capacity alone is misleading.
Nuclear plants in North America typically run at capacity factors above 90 percent. They are expensive to build and cheap to run, so owners operate them at full power whenever possible, and they need refuelling only every one to two years, or continuously while running in the case of CANDU reactors. Wind farms usually achieve 30 to 45 percent, depending on the site and the turbine; solar farms 15 to 25 percent, depending on latitude and tracking. Gas turbines vary widely because they are often used to follow changing demand rather than to run all the time.
Worked problem
Energy from a 300 MW unit
An SMR rated at 300 MW of electricity runs at a capacity factor of 93 percent. How much energy does it deliver in a year, and how many homes using 9 MWh each per year does that match?
Show solution
- Energy at full output for a year: \(300\ \text{MW} \times 8760\ \text{h} = 2\,628\,000\ \text{MWh}\).
- Apply the capacity factor: \(0.93 \times 2\,628\,000 = 2\,444\,000\ \text{MWh} \approx 2.44\ \text{TWh}\).
- Homes matched: \(2\,444\,000 / 9 \approx 272\,000\) homes.
Answer: One small reactor delivers enough energy in a year for roughly a quarter of a million homes. A wind farm with the same nameplate capacity at a 35 percent capacity factor would deliver about 920 GWh, so about 2.7 times the wind capacity would be needed to match the annual energy, and still more storage or backup to match it hour by hour.
Energy density: why so little fuel is needed
The most striking physical fact about nuclear energy is how much energy a small mass of fuel contains. Burning coal releases chemical energy from rearranging electrons in molecules, a few electron volts per reaction. Fission releases nuclear energy from rearranging protons and neutrons in nuclei, about 200 million electron volts per reaction. That factor of tens of millions in energy per reaction appears directly in the fuel needed. Lesson 4 derives the numbers from first principles; the program below gives a first look using round values.
# Annual energy from a 300 MW electric unit at different capacity factors,
# and the fuel or land each option needs (rounded, illustrative values).
HOURS = 8760
plants = [
    ("SMR, 300 MWe", 300, 0.93),
    ("Wind farm, 300 MW", 300, 0.35),
    ("Solar farm, 300 MW", 300, 0.22),
    ("Gas turbine, 300 MW", 300, 0.55),
]
print(f"{'Plant':22}{'Capacity factor':>17}{'Energy, GWh/yr':>16}")
for name, mw, cf in plants:
    gwh = mw * HOURS * cf / 1000
    print(f"{name:22}{cf:>17.0%}{gwh:>16,.0f}")

# Fuel needed per year for the SMR's electricity compared with coal
e_elec = 300e6 * HOURS * 3600 * 0.93   # J of electricity per year
eff = 0.345                             # thermal efficiency of the SMR
heat = e_elec / eff                     # J of heat released in the core
burnup = 50 * 1e9 * 86400 / 1000        # 50 GWd per tonne of uranium, in J per kg
fuel_kg = heat / burnup
coal_eff, coal_mj = 0.38, 24.0          # coal plant efficiency, MJ per kg of coal
coal_t = e_elec / coal_eff / (coal_mj * 1e6) / 1000
co2_t = coal_t * 2.4                    # about 2.4 t of CO2 per t of bituminous coal
print()
print(f"Uranium fuel for one year: {fuel_kg/1000:.1f} t")
print(f"Coal for the same electricity: {coal_t/1e6:.2f} million t")
print(f"CO2 from that coal: {co2_t/1e6:.1f} million t")
print(f"Mass ratio coal : uranium fuel = {coal_t*1000/fuel_kg:,.0f} : 1")Plant Capacity factor Energy, GWh/yr SMR, 300 MWe 93% 2,444 Wind farm, 300 MW 35% 920 Solar farm, 300 MW 22% 578 Gas turbine, 300 MW 55% 1,445 Uranium fuel for one year: 5.9 t Coal for the same electricity: 0.96 million t CO2 from that coal: 2.3 million t Mass ratio coal : uranium fuel = 163,421 : 1
A year of operation for a 300 MW unit needs about six tonnes of enriched uranium fuel, a volume that would fit in a small room. A coal plant producing the same electricity would burn close to a million tonnes of coal, roughly ten thousand rail cars, and release more than two million tonnes of carbon dioxide. The small fuel volume also means that a reactor's fuel cost is a small share of its electricity cost, typically under a fifth, which makes nuclear prices stable even when uranium prices swing.
Emissions over the whole life cycle
A nuclear plant emits no carbon dioxide while it runs. Mining, enrichment, construction, decommissioning and waste management all use energy and materials, however, so a fair comparison counts emissions over the whole life cycle. Life-cycle assessments published by the Intergovernmental Panel on Climate Change (IPCC) and others consistently put nuclear among the lowest-emitting sources, with medians similar to wind and lower than solar.
| Source | Median life-cycle emissions, g CO₂e per kWh | Main contributors |
|---|---|---|
| Coal | 820 | combustion |
| Natural gas, combined cycle | 490 | combustion and methane leaks |
| Solar, utility scale | 48 | panel manufacture |
| Hydro | 24 | construction, reservoir emissions |
| Nuclear | 12 | mining, enrichment, construction |
| Wind, onshore | 11 | turbine manufacture |
These numbers make nuclear one of the tools nearly every long-term decarbonization study includes. Studies differ on how much nuclear is needed and how much it will cost, but most find that adding a firm, low-carbon source that runs regardless of weather reduces the total cost of a very low-carbon grid, because it reduces the amount of storage and excess wind and solar capacity required to cover long, still, dark periods in winter.
Firm, variable and flexible sources
Grid planners group sources by how they behave. Firm sources can produce a predictable output whenever needed: nuclear, hydro with reservoirs, gas, coal, geothermal and biomass. Variable sources produce when the weather allows: wind, solar and run-of-river hydro. Flexible sources can change output quickly to follow demand: gas turbines, reservoir hydro and batteries. A reliable grid needs enough firm capacity to meet peak demand on the worst day of the year, enough flexibility to follow rapid changes, and enough energy over the year to meet total demand.
Large nuclear plants are usually operated as baseload, running at full power continuously. They can reduce output, and some do so routinely in France and in Ontario when demand is low and other supply is high, but because their costs are nearly all fixed, reducing output wastes money. New designs such as the BWRX-300 are being designed with more flexible operation in mind, so that they can follow load in grids with large amounts of wind and solar.
Costs and why they are debated
The cost of electricity from any plant has three main parts: the capital cost of building it, including interest during construction; fixed operating costs such as staff and maintenance; and variable costs such as fuel. Nuclear costs are dominated by capital. Several large projects in North America and Europe in the 2010s ran far over budget and schedule, which raised the cost of their electricity and made investors cautious. Supporters of SMRs argue that building many identical smaller units, with more work done in factories, will reduce costs and risks over time. Critics point out that this has not yet been demonstrated at scale. Engineers working in the field need to understand both arguments, because cost and schedule performance will decide how much nuclear gets built.
Once built, existing reactors are among the cheapest sources of electricity available. Refurbishing or extending the life of an existing plant, which replaces major components and allows decades more operation, generally costs far less per megawatt-hour than building new capacity of any kind. That is why utilities in both countries have invested heavily in life extensions.
More than electricity
About two thirds of the heat produced in a typical water-cooled reactor is rejected to the environment through the condenser, because converting heat to electricity is limited by thermodynamics. Some designs aim to use that heat or higher-temperature heat directly. Possible uses include district heating, industrial process heat for chemical plants and refineries, desalination and hydrogen production. Reactors also produce medical and industrial isotopes, which Lesson 8 covers, and nuclear power has propelled submarines and icebreakers for decades.
Common mistakes
MistakeComparing plants by nameplate capacity alone.
InsteadCompare annual energy, which depends on capacity factor, and consider when the energy is available.
MistakeConfusing megawatts with megawatt-hours.
InsteadMegawatts measure power, a rate; megawatt-hours measure energy, power multiplied by time.
MistakeSaying nuclear plants have zero emissions.
InsteadOperation emits almost no carbon dioxide, but life-cycle emissions are about 12 g CO₂e per kWh.
MistakeAssuming fuel cost drives nuclear electricity prices.
InsteadCapital cost dominates; fuel is typically under a fifth of the cost of nuclear electricity.
MistakeTreating firm and variable sources as interchangeable.
InsteadA reliable grid needs firm capacity for peak demand as well as annual energy.
Summary and key terms
- Electricity demand in Canada and the United States is growing again because of electrification, new industry and data centres.
- Power is a rate measured in watts; energy is power multiplied by time, measured in watt-hours.
- Capacity factor is annual energy divided by rated power times 8760 hours; nuclear plants usually exceed 90 percent.
- Fission releases tens of millions of times more energy per reaction than combustion, so a 300 MW reactor needs only a few tonnes of fuel a year.
- Nuclear life-cycle emissions are among the lowest of any source, similar to wind.
- Nuclear is a firm, low-carbon source whose cost is dominated by capital; construction cost and schedule are the main challenges.
- Capacity
- The maximum power output of a plant, usually in megawatts.
- Capacity factor
- Actual annual energy divided by the energy at full capacity for every hour of the year.
- Firm source
- A source that can deliver a predictable output whenever it is needed.
- Variable source
- A source whose output depends on the weather, such as wind or solar.
- Baseload
- Operation at steady, high output around the clock.
- Life-cycle emissions
- Greenhouse gas emissions over a source's whole life, from material extraction to decommissioning.
- Small modular reactor
- A reactor of up to roughly 300 MW of electricity, designed for factory fabrication and repeated construction.
- Refurbishment
- Replacing major reactor components to extend a plant's operating life by decades.
Practice problems
Work each problem on paper first, then reveal the answer to check.
A 1000 MW plant produced 7.9 TWh last year. What was its capacity factor?
Show answer
7 900 000 MWh / (1000 × 8760) = 0.90, or 90 percent.
How many 300 MW SMRs at 93 percent produce the same energy as a 2000 MW wind farm at 38 percent?
Show answer
Wind: 2000 × 0.38 = 760 MW average. Each SMR: 279 MW average. 760/279 ≈ 2.7 SMRs.
A household uses 10 MWh per year. What average power is that?
Show answer
10 000 kWh / 8760 h = 1.14 kW.
Using the life-cycle medians, how much CO₂e is avoided per year when 2.44 TWh from a nuclear unit replaces gas combined cycle?
Show answer
(490 − 12) g/kWh × 2.44 × 10⁹ kWh = 1.17 × 10¹² g, about 1.2 million tonnes.
In the program, change the SMR capacity factor to 0.85. How much annual energy is lost?
Show answer
About 210 GWh: 2444 − 300 × 8.76 × 0.85 = 2444 − 2234.
Why do nuclear owners avoid reducing output when they can?
Show answer
Almost all their costs are fixed, so electricity not produced is revenue lost with little cost saved.
Lesson quiz · 5 questions
Score 60% or more to complete this lesson.
Create a free account to save your progress, take quizzes and earn a certificate.