
MSAZ-349 · Lesson 7 of 12 · 21 min
Review: threat hunting
▶ Video coming soon A video version of this lesson is on the way.
Threat hunting carries the smallest weight on SC-200, 20 to 25 parts in 100, and it was Ama's weakest group on the diagnostic: 7 of 14. It is also the group where the outline changed most in 2026, with the Sentinel data lake, KQL jobs, summary rules, the Sentinel graph and the MCP server named alongside the older tools. This lesson reviews both areas of the group, hunting in Defender XDR and hunting on the Sentinel platform, with a focus on choosing the right tool for a hunting question. Reading the queries themselves is covered in lesson 8.
Nadia's definition of a hunt is short: a question about the environment that no rule is answering, asked with data, and finished with a decision. The decision may be that nothing was found, that a rule should be written, or that an incident should be opened. Exam questions on hunting usually describe the question and the data, and ask which tool, table or feature to use.
Advanced hunting in Defender XDR
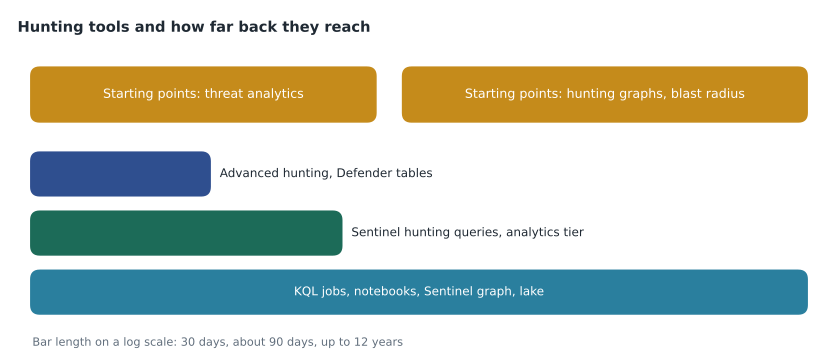
Advanced hunting queries Defender's own tables with KQL. The most used groups are the device tables (DeviceProcessEvents, DeviceNetworkEvents, DeviceFileEvents, DeviceRegistryEvents, DeviceLogonEvents, DeviceImageLoadEvents, DeviceEvents and DeviceInfo), the email tables (EmailEvents, EmailAttachmentInfo, EmailUrlInfo, EmailPostDeliveryEvents and UrlClickEvents), the identity tables (IdentityLogonEvents, IdentityQueryEvents, IdentityDirectoryEvents and IdentityInfo), CloudAppEvents for activity in cloud apps, and AlertInfo with AlertEvidence for alerts across products. Defender keeps 30 days of data in these tables. In the unified platform, advanced hunting can also query Sentinel tables in the analytics tier, so one query can join DeviceLogonEvents with SigninLogs.
The exam often asks which table holds a fact. Ama's matching deck, built from her diagnostic misses, pairs questions with tables: who clicked a link in an email (UrlClickEvents), which attachments a message carried (EmailAttachmentInfo), whether a message was moved or deleted after delivery (EmailPostDeliveryEvents), who queried Active Directory for group membership (IdentityQueryEvents), who changed a group in Active Directory (IdentityDirectoryEvents), and which programs loaded a particular library (DeviceImageLoadEvents).
| Hunting question | Table |
|---|---|
| Which users clicked a URL from a phishing message? | UrlClickEvents |
| Was the message moved by zero-hour auto purge after delivery? | EmailPostDeliveryEvents |
| Which processes connected to an address? | DeviceNetworkEvents |
| Which accounts ran LDAP queries for privileged groups? | IdentityQueryEvents |
| Who added an account to a group in Active Directory? | IdentityDirectoryEvents |
| What did a user do in SharePoint or a third-party cloud app? | CloudAppEvents |
| Which alerts involved a given file hash? | AlertEvidence joined to AlertInfo |
Threat analytics
Threat analytics is Microsoft's library of reports on active threat actors, campaigns, techniques and vulnerabilities, shown in the Defender portal with each report's impact on the organization. A report has an overview, an analyst report with detection and hunting guidance, the related incidents and impacted assets in the tenant, and exposure and mitigation status, such as devices missing a patch or lacking a protection setting. The exam can ask where to start when a new campaign is announced. Threat analytics is usually the answer, because it shows both what the threat does and whether the organization is affected. Harrow & Finch's review on November 9, 2026 used a credential theft report to decide that the local security authority ASR rule should move to Block.
Hunting graphs and the Sentinel graph
The study guide names hunting graphs, including blast radius, and the Sentinel graph. A hunting graph shows entities, such as users, devices, mailboxes and cloud resources, and the relationships between them, so that a hunter can see paths an attacker could follow from a starting point. Blast radius analysis asks the defender's version of Nadia's favourite question: if this account or device is compromised, what else can it reach? The Sentinel graph builds these relationships from data in the Sentinel data lake. Because these features were new during 2025 and 2026, their exact pages and options may change before September 2027. Ama will check them in May, and her exam strategy is to focus on what they are for: graphs show relationships and reachable assets; queries show events.
Hunting queries in Sentinel
Sentinel's hunting page lists hunting queries, from Content hub solutions and from the team, each mapped to MITRE ATT&CK tactics and techniques. A hunter can run all queries, see which return results, and record interesting rows as bookmarks, which keep the query, the time and the entities. Bookmarks can be added to an incident or used to create one. The hunts feature groups queries, bookmarks and notes for one hypothesis. A query that proves its value can be turned into an analytics rule, and the exam may ask for that step: hunt, confirm the pattern, then create a scheduled or near-real-time rule.
At Harrow & Finch's coverage review on November 13, 2026, the team counted 17 of its 24 priority techniques as hunted, compared with 15 that had a tested rule. One hunt from the 4196 investigation became the session-reuse scheduled rule the same day: hourly, over a two-hour lookback, excluding the corporate VPN's addresses through the CorporateVPNEgress watchlist.
KQL jobs and summary rules
Data in the lake tier is not available to analytics rules or ordinary hunting queries, and two features bridge the gap. A KQL job runs a KQL query over lake data, once or on a schedule, and writes the results into a table in the analytics tier, where rules, workbooks and hunting can use them. It is the right answer when a hunter needs to bring a slice of old or lake-only data into analytics, such as six months of firewall flow logs for one store. A summary rule runs a KQL query on a schedule over recent data and writes aggregated results to a custom table. It is the right answer when the need is a long-term, lower-volume summary of a high-volume table, such as hourly bytes per firewall, kept far longer than the raw rows.
| Need | Feature |
|---|---|
| Bring old data from the lake into analytics for an investigation | KQL job, run once |
| Copy a lake-only table slice into analytics every day | KQL job, scheduled |
| Keep hourly totals from a noisy table for a year | Summary rule |
| Explore lake data with Python and Spark | Notebook |
| Ask questions of lake data through an AI agent | Sentinel MCP server |
Notebooks and the MCP server
Notebooks let a hunter analyze lake data with Python and Apache Spark, working in Visual Studio Code with the Sentinel extension. They suit questions that KQL handles badly, such as joining months of data with external lists, building models of normal behaviour or producing charts for a report. A notebook can write results back to a table. Ama's first notebook session on November 13, 2026 produced the KitRangeHistory_SPRK table, which showed that no sign-ins had come from the phishing kit's address ranges between May and November. The Sentinel MCP server exposes the data lake to AI agents through the Model Context Protocol, so that an agent, such as one in Security Copilot or Visual Studio Code, can explore tables and run queries for an analyst who asks in plain language. The exam is likely to ask what each is for rather than how to configure them.
DeviceNetworkEvents
| where Timestamp > ago(7d)
| where RemoteIP in ("198.51.100.73", "198.51.100.74")
| summarize Connections = count(), Devices = dcount(DeviceId)
    by RemoteIP, InitiatingProcessFileName
The query above shows the shape of most hunts: one table, a time filter, a filter for the indicator and a summary that answers the question. The addresses are documentation placeholders. Because DeviceNetworkEvents is a Defender table, the query runs in advanced hunting over up to 30 days; to look back further, the same table's lake copy would be reached with a KQL job or a notebook.
Where hunting hypotheses come from
A hunt needs a question, and the exam sometimes asks where a good question comes from. There are four common sources. Threat intelligence, such as a threat analytics report, gives a specific actor's behaviour and indicators. MITRE ATT&CK coverage gaps give techniques that no rule watches. Incidents give leads: what else did the attacker try, and where else might the same method have worked? And changes in the environment, such as a new remote access tool or a new cloud app, give places where normal behaviour is not yet known.
Harrow & Finch's hunting calendar for the first quarter of 2027 draws on all four. In January, Ama and Nadia will hunt for scheduled tasks created by unusual parent processes, which defenders know as MITRE ATT&CK technique T1053, Scheduled Task/Job, because it was one of the seven priority techniques not yet hunted. In February, they will repeat the 4196 hunt for sessions used from two countries within an hour, to check whether the new rule misses anything. In March, they will hunt new service installations on till PCs, T1543, Create or Modify System Process, using the event ID 4697 records that the Windows Event Forwarding subscription already collects.
Behaviour analytics in hunting
User and entity behaviour analytics (UEBA) in Sentinel adds tables that make hunting faster. BehaviorAnalytics enriches sign-in and activity events with flags such as first time a user connected from a country or used an application, and a priority score from 0 to 10. Anomalies holds the results of anomaly rules. IdentityInfo holds account details, such as department and manager, gathered from Entra ID and Active Directory. Joining a hunt's results to IdentityInfo turns a list of account names into a list of people with roles, which makes the next decision easier.
The exam can ask what UEBA provides that raw logs do not. The answer is context: a baseline of what is normal for a user and their peers, so that a sign-in from a new country is scored differently for a buyer who travels than for a till operator who never has. Harrow & Finch enabled UEBA on November 11, 2026, with Entra ID, Defender for Identity and Office 365 as sources, and its first high-priority result, a store manager's new phone, turned out to be benign.
BehaviorAnalytics
| where TimeGenerated > ago(7d)
| where InvestigationPriority >= 5
| join kind=leftouter (IdentityInfo | summarize arg_max(TimeGenerated, *) by AccountUPN)
    on $left.UserPrincipalName == $right.AccountUPN
| project TimeGenerated, UserPrincipalName, Department, ActivityType,
          ActionType, InvestigationPriority
| order by InvestigationPriority desc
Exposure data for hunting
Microsoft Security Exposure Management adds two advanced hunting tables, ExposureGraphNodes and ExposureGraphEdges, which hold the assets and relationships behind attack paths and blast radius views. A hunter can query them to find, for example, every device on which a privileged account has an active session, or every path from an internet-facing server to a sensitive storage account. The exam is more likely to ask what these tables represent than to ask for the syntax of a graph query. Nodes are entities such as devices, identities and cloud resources; edges are relationships such as 'can authenticate to' or 'has permissions on'.
Finishing a hunt
A hunt is not finished until its decision is recorded. Sentinel's hunts feature keeps the hypothesis, queries, bookmarks and notes together, and the team can close a hunt with an outcome. Harrow & Finch records three things for every hunt: the question, the data and time range used, and the decision. If the decision is to write a rule, the rule's name is added to the record. If nothing was found, the record says how far back the search reached, so the next hunter knows whether to repeat it or extend it. Nadia's rule is that 'nothing found in 30 days' and 'nothing found in a year' are different results and must never be written the same way.
For the exam, the finishing step usually appears as the last item in an ordering question or as the right answer to 'what should you do next'. When the pattern found is malicious and current, the next step is an incident. When it is malicious but historical, the next step is scoping and then an incident. When it is a useful signal for the future, the next step is a rule. When it is benign, the next step is to record why, so the same pattern can be excluded from future hunts and rules with confidence.
Worked problem
Choosing the hunting tool
In May 2027, a threat analytics report describes a campaign whose infrastructure was active from January to March 2027. Nadia wants to know whether any Harrow & Finch device connected to its addresses during that period, and to keep the results for a workbook. Which tool should Ama use?
Show solution
- The period is January to March; in May, that is more than 30 days ago, so advanced hunting's Defender tables no longer hold it.
- Harrow & Finch streams DeviceNetworkEvents to Sentinel with 90 days in analytics and a year in total, so the data is in the lake for the earlier part of the period.
- Analytics rules and workbooks cannot read the lake directly.
- A KQL job can query the lake copy for the campaign's addresses and write matching rows to an analytics table.
- The workbook can then read that table.
Answer: Run a KQL job over the lake copy of DeviceNetworkEvents for January to March, writing results to an analytics table for the workbook.
Common mistakes
MistakeAdvanced hunting can always look back 90 days.
InsteadDefender's own tables keep 30 days; longer reach needs Sentinel tables or the lake.
MistakeThreat analytics is only background reading.
InsteadEach report shows the organization's related incidents, impacted assets and mitigation status.
MistakeA summary rule moves raw data to the lake.
InsteadA summary rule writes aggregated results to a custom table; KQL jobs move query results from the lake to analytics.
MistakeBookmarks are the same as incidents.
InsteadA bookmark saves query results and entities; it can be added to or create an incident.
MistakeHunting graphs replace queries.
InsteadGraphs show relationships and reachable assets; queries show events.
Summary and key terms
- Advanced hunting covers Defender tables for 30 days and can also query Sentinel analytics tables.
- Know which table answers which question: email, device, identity, cloud app and alert tables.
- Threat analytics shows a threat's behaviour and the organization's exposure to it.
- Hunting graphs and blast radius show what an entity can reach; the Sentinel graph builds relationships from lake data.
- Sentinel hunting queries, bookmarks and hunts organize hypotheses; good hunts become rules.
- KQL jobs bring lake data into analytics, summary rules keep aggregates, notebooks analyze at scale, and the MCP server lets agents query the lake.
- Advanced hunting
- KQL querying of Defender XDR and Sentinel tables in the Defender portal.
- Bookmark
- A saved set of hunting results with the query, time and entities.
- KQL job
- A one-time or scheduled query over lake data that writes results to an analytics table.
- Summary rule
- A scheduled query that writes aggregated results to a custom table.
- Blast radius
- The set of assets an attacker could reach from a compromised entity.
Practice problems
Work each problem on paper first, then reveal the answer to check.
Which table shows which users clicked a URL from an email?
Show answer
UrlClickEvents.
How long do Defender's advanced hunting tables keep data?
Show answer
30 days.
Which feature brings lake data into the analytics tier?
Show answer
A KQL job.
Which feature keeps hourly totals from a noisy table for a long time?
Show answer
A summary rule.
Where should an analyst start when Microsoft reports a new campaign?
Show answer
Threat analytics, which shows the threat and the organization's exposure.
Lesson quiz · 5 questions
Score 60% or more to complete this lesson.
Create a free account to save your progress, take quizzes and earn a certificate.