
MSAZ-329 · Lesson 6 of 12 · 20 min
Review: monitoring and optimizing
▶ Video coming soon A video version of this lesson is on the way.
Monitoring and optimizing was Ines's weakest group on the diagnostic, at 10 of 20. Going through the misses, Nikolai sorted them into three kinds. Some were about where to look: she reached for the Monitor hub when the question needed the Capacity Metrics app, or the other way round. Some were about error messages from items she had never used in production, such as eventstreams and semantic model refreshes. The rest were about choosing the most effective fix for a slow item when several fixes would help a little. This lesson reviews the group's three areas with those three kinds of question in mind.
The group has 16 skills, all practical. Microsoft expects a candidate to know what normal looks like for each kind of Fabric item, to read the signs when something goes wrong, and to know the main levers for making things faster or cheaper.
Monitoring Fabric items
The outline names four monitoring skills: monitor data ingestion, monitor data transformation, monitor semantic model refresh, and configure alerts. Most of them start in the Monitor hub, which lists recent runs of pipelines, dataflows, notebooks, Spark job definitions, semantic model refreshes and other jobs across the workspaces a person can see, with status, start time, duration and a link to details. For a pipeline, the details show each activity's input, output, duration and error. For a notebook, they link to the Spark application, its logs and the Spark UI. For a semantic model, the refresh history shows each refresh with its status and any error.
Other tools answer other questions. The Fabric Capacity Metrics app shows how much of a capacity's compute each item used over the last 14 days, how smoothing spread the load, and whether the capacity reached throttling. Workspace monitoring, in preview, sends logs and metrics for a workspace's items to an eventhouse where they can be queried with KQL. An eventstream shows data insights and runtime logs for its sources and destinations. An eventhouse can be queried for its own ingestion results and failures.
| Question | Where to look first |
|---|---|
| Did last night's pipeline run, and which activity failed? | Monitor hub, then the pipeline run details |
| Why were reports slow at 8 a.m. across the whole capacity? | Capacity Metrics app: utilization, smoothing and throttling |
| Which notebook stage spilled to disk? | Spark application details and the Spark UI |
| Did the semantic model refresh after the load? | Monitor hub or the model's refresh history |
| How many events reached the eventhouse in the last hour? | Eventstream data insights and a KQL query on the table |
| Which queries ran longest in the warehouse yesterday? | Query insights views in the warehouse |
Alerts close the loop. A pipeline can send a notification on failure with an email or Teams activity on its failure path. Activator can watch job events, eventstream data or eventhouse queries and act when a condition is met, such as a nightly load failing or a freezer warming. Fabric also lets owners subscribe to job notifications. The freezer pilot's Nightly load failed rule is an example: it listens for the pipeline's failure event and posts to the data team's channel.
Identifying and resolving errors
The errors area lists six item types: pipelines, dataflows, notebooks, eventhouses, eventstreams and T-SQL. Each fails in typical ways, and questions usually give a symptom or an error message and ask for the cause or fix.
| Item | Typical symptom | Typical cause and fix |
|---|---|---|
| Pipeline | Copy activity fails at 1 a.m. with a connection error | Gateway offline or credentials expired; fix the gateway or connection, add a retry |
| Dataflow | Refresh fails after a password change | Connection credentials out of date; update them or use a service principal |
| Notebook | Job fails with an out-of-memory error on the driver | Collecting a large result to the driver; aggregate first or write instead of collect |
| Eventhouse | Rows stop appearing in the cleaned table | An update policy query broke after a source column changed; fix the policy |
| Eventstream | A destination shows errors and events are dropped | Schema or data type mismatch with the destination table; adjust the mapping |
| T-SQL | Two loads fail with an update conflict | Snapshot isolation conflict from concurrent updates to the same table; run them one at a time |
Ines met several of these this fall. On October 31 a dataflow failed when a password changed, and the team moved its connection to a service principal. On November 4 two runs of the warehouse load collided and one failed with a snapshot isolation update conflict, which was fixed by setting the pipeline's concurrency to one. On November 10 an update policy in eh_sensors stopped working after a column was renamed upstream. The exam will describe other companies' versions of the same problems, so the useful habit is to ask for each symptom: what changed, and which component sits between the source and the failure?
Optimizing a lakehouse table
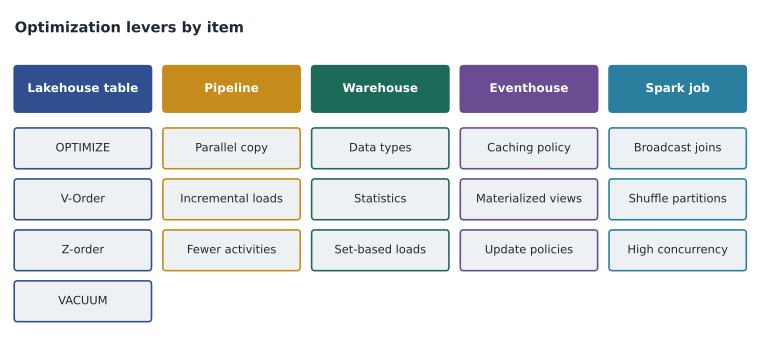
Lakehouse tables are Delta tables made of Parquet files plus a transaction log. They get slow when they accumulate many small files, when queries scan more files than they need, or when old file versions pile up. OPTIMIZE compacts small files into larger ones; V-Order arranges data inside Parquet files for faster reads by Fabric engines; Z-order clusters rows by chosen columns so that filters on them skip files. VACUUM removes files that are no longer referenced and are older than the retention period, seven days by default. Optimize write and auto compaction reduce small files as data is written. Partitioning by a low-cardinality column such as a date helps only when tables are large and queries filter on that column; partitioning a small table makes things worse.
In November the raw sales table had 1,183 files before an OPTIMIZE and 31 after. That is the classic small-file case, and the exam's version usually says something like 'queries on a table updated every few minutes are slow, and the table has thousands of small files'.
Optimizing pipelines, warehouses and eventhouses
For a pipeline, the main levers are parallelism and avoiding unnecessary work: copy partitions in parallel, use incremental loads instead of full ones, run independent activities at the same time instead of in sequence, and set sensible timeouts and retries. For a warehouse, the levers are table design and statistics: choose appropriate data types, avoid many single-row inserts in favour of set-based loads, keep statistics up to date, and use result set caching where it applies. Query insights show which queries are slow and why.
For eventstreams and eventhouses, the levers are throughput and data layout. An eventstream can be scaled for more throughput and should filter early so fewer events travel. An eventhouse benefits from a caching policy that keeps recent, frequently queried data in hot cache, from materialized views that precompute common aggregates, and from update policies that clean data once at ingestion instead of in every query. Ingestion batching settings trade a little latency for efficiency.
Optimizing Spark and queries
Spark jobs speed up when they avoid shuffles, use the right partition count and read less data. Broadcast joins send a small table to every executor instead of shuffling a large one. The number of shuffle partitions should suit the data size: the default of 200 is too many for a small nightly job. High concurrency and the starter pool cut session start time. The native execution engine runs supported operations faster. Resource profiles set Spark properties for write-heavy or read-heavy work. In November, removing an unneeded library and turning on high concurrency cut the nightly start-up from about 7 minutes to under 2.
Query performance depends on reading as little as possible. Filters that can be pushed to the storage layer let engines skip files. A filter wrapped in a function, such as extracting the year from a date, can stop that from happening, whereas a range on the date column itself allows it. In Direct Lake semantic models, some views and features cause a fallback to DirectQuery, which is slower; Keiko's report in November is an example, fixed by moving the logic into a table.
Semantic model refresh
Monitoring a semantic model refresh is on the outline even though building models belongs to DP-600, because a data engineer's load is not finished until the reports that depend on it show new data. A model in import mode holds a copy of the data and must be refreshed after each load. A Direct Lake model reads Delta tables in OneLake directly and picks up new data by reframing, which happens automatically by default when the underlying tables change, or on a schedule or trigger if automatic updates are turned off. A model can also mix storage modes.
Refresh history shows each refresh with its start, end, status and error. Typical failures are expired credentials for a source, a column that was renamed or removed upstream, a refresh that runs out of memory on a small capacity, and a refresh that times out because it started before the load finished. The last one is a sequencing problem: the fix is to trigger the refresh from the pipeline after the load succeeds, with a semantic model refresh activity, rather than scheduling both and hoping. For Direct Lake models, a question may mention that reports fall back to DirectQuery and run slowly; the cause is usually a feature or a table size that Direct Lake does not support on that capacity, and the fix is to change the model or the table rather than to refresh more often.
Optimizing a warehouse in more detail
Warehouse questions often describe a slow load or a slow query and offer four fixes. The fixes that matter most are usually these. Load in sets, not rows: COPY INTO, CREATE TABLE AS SELECT and INSERT ... SELECT are far faster than many single-row inserts, which also create many small files. Use suitable data types: a column of short codes stored as a very long varchar wastes memory and slows sorting; dates stored as strings stop range filters from working well. Keep statistics current: the warehouse creates and updates statistics automatically in many cases, but after a large load, updating statistics on the key columns can help the optimizer choose a better plan. Avoid running many conflicting updates against one table at the same time, which can fail under snapshot isolation.
Query insights help find the problem. They are system views that list completed queries with their duration, the data scanned and how often a query shape runs. Nikolai's habit is to sort by total time, not by single slowest query: a two-second query that runs ten thousand times a day costs more than one slow monthly report.
The same habit applies to the exam. When a question describes a slow warehouse and offers four fixes, the best answer is usually the one that removes the most work, such as loading in sets or skipping data with a better filter, rather than one that only makes the same work a little faster.
Worked problem
Choosing the most effective fix
A lakehouse table receives a micro-batch every 2 minutes. After three weeks, a report query that filters on SaleDate takes 40 seconds, and the table has 15,000 files averaging 300 KB. Which single change will help most?
Show solution
- The symptom is many small files: about 15,000 files of 300 KB each, roughly 4.5 GB in total.
- \[15{,}000 \times 0.3\ \text{MB} = 4{,}500\ \text{MB}\]
- Partitioning by SaleDate would add more, smaller files for a table this size. Not the best first step.
- VACUUM removes old, unreferenced files but does not merge the current small ones.
- OPTIMIZE compacts the current files into far fewer large ones, and auto compaction keeps them compact as new batches arrive.
Answer: Run OPTIMIZE, with Z-order on SaleDate if the query filters on it, and turn on auto compaction for future writes.
Common mistakes
MistakeThe Monitor hub shows how much capacity each item used over two weeks.
InsteadThat is the Capacity Metrics app; the Monitor hub shows job runs and their status.
MistakeVACUUM merges small files.
InsteadVACUUM deletes unreferenced files older than the retention period; OPTIMIZE merges small files.
MistakePartitioning always speeds up a Delta table.
InsteadPartitioning helps large tables filtered on the partition column; on small tables it creates more small files.
MistakeThe default 200 shuffle partitions suits every job.
InsteadSmall jobs run faster with fewer partitions; set the count to suit the data size.
MistakeAn update conflict in the warehouse is a data quality problem.
InsteadIt is a concurrency problem: two transactions updated the same table at once.
Summary and key terms
- Use the Monitor hub for job runs, the Capacity Metrics app for capacity use and throttling, and item-specific views for details.
- Configure alerts with pipeline failure paths, Activator rules on job events or data, and job notifications.
- Know typical errors for pipelines, dataflows, notebooks, eventhouses, eventstreams and T-SQL, and ask what changed upstream.
- Optimize lakehouse tables with OPTIMIZE, V-Order, Z-order, VACUUM and auto compaction; partition only large, filtered tables.
- Optimize pipelines with parallel and incremental copies, warehouses with good design and statistics, and eventhouses with caching, materialized views and update policies.
- Optimize Spark with broadcast joins, suitable shuffle partitions and high concurrency, and queries with filters that can be pushed down.
- Monitor hub
- The Fabric view that lists recent runs of jobs across workspaces, with status and details.
- Capacity Metrics app
- A Fabric app that shows compute use by item, smoothing and throttling for a capacity.
- OPTIMIZE
- A Delta command that compacts small files into larger ones.
- VACUUM
- A Delta command that removes unreferenced files older than the retention period.
- Broadcast join
- A Spark join that copies a small table to every executor to avoid shuffling a large one.
Practice problems
Work each problem on paper first, then reveal the answer to check.
Where would you check whether a capacity reached throttling yesterday?
Show answer
The Fabric Capacity Metrics app.
What is the default VACUUM retention period?
Show answer
Seven days.
What usually causes a snapshot isolation update conflict in a warehouse load?
Show answer
Two transactions updating the same table at the same time.
Which eventhouse feature precomputes common aggregates?
Show answer
Materialized views.
Why can wrapping a date column in a function slow a query?
Show answer
It can stop the filter being pushed down, so the engine cannot skip files.
Lesson quiz · 5 questions
Score 60% or more to complete this lesson.
Create a free account to save your progress, take quizzes and earn a certificate.