
MSAZ-312 · Lesson 9 of 12 · 20 min
Reusable assets: templates and shared models
▶ Video coming soon A video version of this lesson is on the way.
On Monday, November 9 Dana came to the session with a request. Five analysts in her finance team built reports of their own, and each of them had a private copy of Finance Margin, or of an older version of it, inside their own PBIX files. Each copy refreshed separately, some through the gateway that Rosa had just retired, and their numbers did not always agree with the margin pack. Dana wanted one set of numbers and less work for her team. Marisol's answer was reuse: one shared model that everyone connects to, a template that starts every new finance report the same way, and a connection file that points anyone who needs raw data at the right place.
The DP-600 outline groups these under creating and managing reusable assets. It names three: Power BI template files (.pbit), Power BI data source files (.pbids), and shared semantic models. Marisol added a fourth that the team already used, the Power BI project format from MSAZ-311, and explained how each fits a different moment in a report's life.
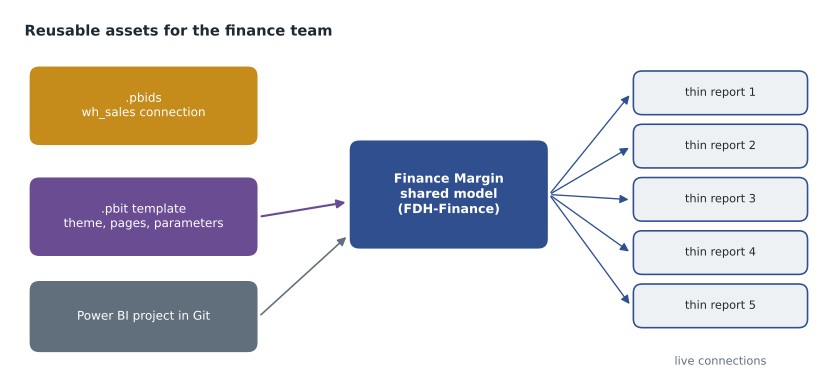
Shared semantic models
A shared semantic model is one published model that many reports use. A report connects to it with a live connection: in Power BI Desktop the author chooses Power BI semantic models from the Get data menu, or the OneLake catalog, and picks the model. The report then has no model of its own; it sends its queries to the shared model, and it is called a thin report. Every thin report shows the same measures, the same security roles and the same refresh, so numbers agree by design. A change to a measure reaches all reports at once, which is both the benefit and the reason lesson 10 matters.
To build a report on a shared model, a user needs Build permission on it. Workspace members with the Contributor role or higher have it automatically; anyone else gets it when the model is shared with them with the option to build content, or through an app's settings. Viewers without Build can read reports but cannot create their own. Dana's five analysts were not members of FDH-Finance, so Marisol asked Elena to grant Build on Finance Margin to a security group for the finance analysts, rather than to the five people one by one.
| Permission on a semantic model | Lets a user |
|---|---|
| Read | View reports built on the model; row-level security applies |
| Build | Create reports and composite models on it, use Analyze in Excel, and query it with external tools |
| Reshare | Share the model with other people |
| Write | Change the model's settings and, through XMLA, its definition |
The row-level security from MSAZ-311 carried over to thin reports. When a store manager opens a thin report on Sales Overview, their roles apply, because the queries run against the shared model under their identity. Finance Margin had only one role, for the finance group, but Marisol checked that no analyst had the Admin, Member or Contributor role in the workspace, because row-level security does not restrict users with those roles.
Extending a shared model
Analysts sometimes need something the shared model does not have, such as a budget table kept in a spreadsheet. A composite model on a Power BI semantic model handles that: in Desktop, the analyst connects live to the shared model, then chooses to make changes to the model, which turns the live connection into a DirectQuery connection to the shared model. They can then add their own import tables and relationships to them. The shared model stays as it is; the analyst's file holds only the additions. Microsoft describes chaining limits for this, and the tenant settings must allow DirectQuery connections to Power BI semantic models. Marisol was cautious: composite models are useful for a one-off analysis, but a table that many analysts need belongs in the shared model.
Measures added in a thin report are another option. A thin report can contain report-level measures that only it uses, built on top of the shared model's measures, with no model of its own. Rosa thought these were the right home for analysts' experiments. If a report measure became widely used, it could be moved into the shared model with ALM Toolkit and the checklist from lesson 5.
Power BI templates
A Power BI template, a .pbit file, is a PBIX without data. It contains the report pages, visuals, theme, model definition, Power Query queries and parameters. When someone opens it, Desktop asks for the values of any parameters, loads the data, and creates a new, unsaved report. Templates are for starting new reports the same way, not for sharing data. A report saved as a template from File > Export > Power BI template can also carry a description that Desktop shows when the template opens.
The finance team's template, Finance report.pbit, held the company theme and the standard header and footer, a cover page with the reporting period, a notes page for method and sources, and a live connection to Finance Margin. That last choice meant that the template had no model of its own at all, only the connection, so every report started from it was a thin report on the shared model. Keiko also built a second template for analysts who needed raw data from the warehouse, with a parameter for the fiscal year and Power Query steps that read from wh_sales with the folding filters lesson 4 had used.
Templates should be kept where people find them and in version control. Marisol put both in the hub's Git repository and in a SharePoint folder linked from the finance team's channel, with a short readme. A template is a binary file, so Git cannot show what changed inside it; the readme recorded a version number and a one-line note for each change.
Power BI data source files
A .pbids file is a small JSON file that describes one data source. When someone opens it, Power BI Desktop starts with the Get data step already pointed at that source: the user signs in, chooses tables and goes on as normal. It holds no credentials and no data, only the source's details, and it can name only one data source. Analysts used it to connect to the warehouse without having to know its SQL connection string.
{
  "version": "0.1",
  "connections": [
    {
      "details": {
        "protocol": "tds",
        "address": {
          "server": "<wh_sales SQL connection string>",
          "database": "wh_sales"
        }
      },
      "mode": "DirectQuery"
    }
  ]
}
Marisol made a .pbids for the wh_sales warehouse and one for the curated lakehouse's SQL endpoint, and put them next to the templates. She was clear about when each asset applies: a .pbids helps someone start from raw data, a template helps someone start a standard report, and a shared model is where most reports should end up. A report started from a .pbids that turns into a regular finance report should be rebuilt on the shared model.
| Asset | Contains | Holds data? | Typical use |
|---|---|---|---|
| .pbids | One data source definition | No | Start a new file connected to an approved source |
| .pbit | Pages, theme, model definition, queries, parameters | No | Start new reports from a standard design |
| Shared semantic model | A published model with measures and roles | Yes, in the service | One source of truth for many thin reports |
| Power BI project (.pbip) | Report and model definition as text files | No | Version control and team development |
Moving the analysts over
Moving five analysts to the shared model took the rest of the week. Keiko listed the analysts' reports, 17 in all, with the scanner results that lesson 10 explains, and checked which of them used anything Finance Margin did not have. Twelve used only measures that the shared model already had under the same or similar names. Four used a budget table from a spreadsheet, which Rosa added to the shared model as a small import table after Dana agreed it was the official budget. One used a currency conversion that nobody could explain, and the analyst who had built it agreed to retire it.
# Refresh work before and after moving analysts to the shared model
private_copies = 17          # reports with their own copy of the model
minutes_each = 25            # average refresh time of a private copy
shared_minutes = 9           # nightly incremental refresh of Finance Margin

before = private_copies * minutes_each + shared_minutes
after = shared_minutes
print("Refresh minutes per night before:", before)
print("Refresh minutes per night after:", after)
print("Minutes saved per night:", before - after)
print("Hours saved per year:", round((before - after) * 365 / 60))Refresh minutes per night before: 434 Refresh minutes per night after: 9 Minutes saved per night: 425 Hours saved per year: 2585
What this code does
The block multiplies the number of reports that kept private copies of the model by their average refresh time, adds the shared model's own nightly refresh, and compares that with the shared model alone. It prints the minutes saved each night and turns them into hours over a year.
The estimate showed 425 minutes of refresh work removed every night, about 2,600 hours a year of capacity time and gateway time that had been spent loading the same rows into 17 places. The bigger gain, Dana said, was that the margin pack and the analysts' reports would now always agree.
Worked problem
Which asset fits?
Four requests arrive: (a) a new analyst wants to explore the curated lakehouse tables for a one-off question; (b) the merchandising team wants a new monthly report that looks like the finance reports; (c) twelve reports need the same Gross Margin Pct; (d) the team wants to review changes to the margin pack in pull requests. Which asset fits each?
Show solution
- (a) needs a connection to an approved source without building a standard report: a .pbids file for the lakehouse SQL endpoint.
- (b) should start from the standard design: the .pbit template, which connects to the shared model.
- (c) is a single definition used by many: the measure in the shared semantic model, with thin reports.
- (d) needs text that Git can compare: the Power BI project format.
Answer: .pbids for (a), .pbit for (b), the shared model for (c) and a Power BI project for (d).
Naming and describing shared measures
A shared model is only useful if people can find what they need in it, and the analysts' first complaint was that Finance Margin had 64 measures in a single list. Rosa and Keiko spent part of the session organizing them. Measures went into display folders by subject: Sales, Cost, Margin, Shrink and Budget, with a Time Comparison folder for the calculation group from MSAZ-311. Helper measures that only existed to build other measures were hidden. Every visible measure got a description in plain language, which appears as a tooltip in the field list, saying what it calculates, which filters it ignores, if any, and who to ask about it. The Best Practice Analyzer rule from lesson 6 that flags measures without descriptions made sure new measures did not slip through.
Names were harder. Two analysts had used Margin, two had used GM, and one had used Gross Profit for the same calculation. The shared model used Gross Margin, matching the margin pack, and Rosa added a short glossary to the model's description listing the old names and the measure that replaced each. Marisol recommended against creating duplicate measures with the old names to ease the move, because duplicates would outlive the move by years and confuse the next analyst.
Finally, the team agreed how analysts could ask for changes. A request for a new shared measure went to a form in the finance team's channel, with the definition in words, an example number that finance had already checked, and the reports that would use it. Rosa reviewed requests every Tuesday. In the first week she received three requests, accepted two and showed the third analyst that the measure already existed under a different name, which was itself a reason to improve the descriptions.
Common mistakes
MistakeA template shares data with colleagues.
InsteadA .pbit contains no data; whoever opens it loads data with their own access.
MistakeA .pbids file stores the user's credentials.
InsteadIt stores only the source's details; the user signs in.
MistakeAnyone who can see a report can build a new one on its model.
InsteadBuilding needs Build permission on the semantic model.
MistakeEach analyst should keep a private copy of the model to be safe.
InsteadPrivate copies drift apart and multiply refresh work; thin reports on a shared model agree by design.
Summary and key terms
- A shared semantic model serves many thin reports through live connections; changes reach all of them at once.
- Building on a shared model needs Build permission; grant it to groups.
- Composite models on a Power BI semantic model let analysts add tables without changing the shared model.
- A .pbit template holds pages, theme, model definition, queries and parameters, but no data.
- A .pbids file describes one data source so Desktop opens at the connection step.
- Power BI projects store definitions as text for version control.
- Shared semantic model
- A published model used by many reports through live connections.
- Thin report
- A report with no model of its own, connected live to a shared semantic model.
- Build permission
- A semantic model permission that lets a user create reports and other content on it.
- Power BI template (.pbit)
- A file with a report's pages, model definition, queries and parameters but no data.
- Power BI data source file (.pbids)
- A JSON file that describes one data source and opens Desktop connected to it.
- Live connection
- A report connection that sends queries to a published semantic model.
Practice problems
Work each problem on paper first, then reveal the answer to check.
What did Dana want from the session?
Show answer
One set of numbers for her analysts and less refresh work.
Who gets Build permission automatically?
Show answer
Workspace members with the Contributor role or higher.
What did the finance template contain instead of a model?
Show answer
A live connection to Finance Margin.
How many data sources can a .pbids file describe?
Show answer
One.
How many minutes of nightly refresh work did the move remove?
Show answer
425 minutes.
Lesson quiz · 5 questions
Score 60% or more to complete this lesson.
Create a free account to save your progress, take quizzes and earn a certificate.