
MSAZ-312 · Lesson 2 of 12 · 21 min
DAX optimization
▶ Video coming soon A video version of this lesson is on the way.
The second tune session, on Wednesday, October 28, started from the store page of the margin pack, which still took 6.2 seconds after the column changes. Performance Analyzer in Power BI Desktop, covered in lesson 8, showed that almost all of that time went into one matrix visual: stores on rows, with Margin Pct, Margin Pct vs Region and Margin Rank. Rosa copied the DAX query that the visual sent and pasted it into DAX Studio, connected to the trial workspace through the XMLA endpoint. Marisol wanted the group to see what the engine was doing, not guess.
Server timings
DAX Studio's Server Timings pane records what happens inside the engine while a query runs. It shows the total duration, how much of it was spent in the formula engine and how much in the storage engine, how many storage engine queries ran, and the text of each one in a SQL-like form called xmSQL. It also shows whether a storage engine query hit the cache, and whether it contained a callback, a point where VertiPaq had to call the formula engine for each row because it could not evaluate an expression on its own. Before measuring, DAX Studio can clear the cache, so that each test starts cold and results can be compared fairly.
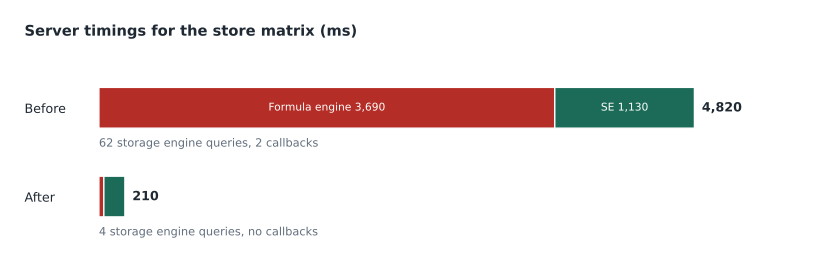
The first run of the matrix query took 4,820 milliseconds. Of that, 3,690 were in the formula engine and 1,130 in the storage engine, spread across 62 storage engine queries. Two of the queries contained CallbackDataID, the marker of a callback. Marisol pointed at the split: when the formula engine takes three quarters of the time and the storage engine runs dozens of queries, the measure is usually asking for work one row or one store at a time instead of in bulk.
What was wrong with the measure
The slowest measure was Margin Pct vs Region, written years earlier. It worked, but in a way that forced the engine to do far more than it needed.
Margin Pct vs Region (old) =
VAR StoreMargin = [Margin Pct]
VAR RegionMargin =
    CALCULATE (
        [Margin Pct],
        FILTER (
            ALL ( fact_sales ),
            RELATED ( dim_store[Region] ) = SELECTEDVALUE ( dim_store[Region] )
        )
    )
RETURN
    IF ( ISBLANK ( StoreMargin ), BLANK (), StoreMargin - RegionMargin )
Three things made it slow. FILTER over ALL(fact_sales) told the engine to build a table of every sales line, about 41 million rows, and test a condition on each one. The condition used RELATED to look up the region for every row, which VertiPaq cannot do in a plain scan, so it called back into the formula engine. And ALL(fact_sales) removed every filter from the fact table, including the date filter from the report's slicer, so the measure had to restore it implicitly through the relationship to dim_date in a roundabout way; in fact it was returning the region's margin for all time, not for the selected quarter, which nobody had noticed because the differences were small.
The fix was to filter the dimension instead of the fact table, and to change only the filters that needed changing.
Margin Pct vs Region =
VAR StoreMargin = [Margin Pct]
VAR CurrentRegion = SELECTEDVALUE ( dim_store[Region] )
VAR RegionMargin =
    CALCULATE (
        [Margin Pct],
        REMOVEFILTERS ( dim_store ),
        dim_store[Region] = CurrentRegion
    )
RETURN
    IF ( NOT ISBLANK ( StoreMargin ), StoreMargin - RegionMargin )
REMOVEFILTERS(dim_store) clears the store filter coming from the matrix row, and the Boolean filter dim_store[Region] = CurrentRegion puts back a filter on the region column alone. The date slicer is untouched, so the result now respects the selected quarter. The engine can answer it with a few scans grouped by region, with no row-by-row work. The IF also changed: returning nothing when there is no store margin is the same as returning BLANK(), and leaving out the else branch is slightly simpler for the engine.
After the rewrite the same query took 210 milliseconds: 40 in the formula engine, 170 in the storage engine, four storage engine queries and no callbacks. Rosa checked the numbers against the warehouse with a T-SQL query for the third fiscal quarter and found that the new measure matched it and the old one did not, by up to 0.6 points for one region. The performance fix had found a bug.
Patterns that help
Marisol's list of DAX habits for performance was short, and each item came with the reason behind it.
- Filter columns, not tables. A Boolean filter such as dim_store[Region] = "Prairie" inside CALCULATE becomes a filter on one column, which the storage engine handles directly. FILTER over a whole table forces the engine to materialize rows and evaluate an expression on each.
- Filter dimensions, not facts. A filter on a dimension with a few hundred rows reaches the fact table through the relationship, which VertiPaq handles very efficiently. A filter written against a fact table with tens of millions of rows does the same job the hard way.
- Use variables. A variable is evaluated once, where it is defined, and reused; repeating the same measure reference three times in one expression may evaluate it three times. Variables also make measures easier to read and to debug in DAX query view.
- Prefer DIVIDE for ratios. DIVIDE handles division by zero without an IF and is optimized for that pattern.
- Keep iterators over small tables. SUMX over a dimension or over VALUES of a column is usually cheap; SUMX over a fact table with a complex expression for each row can be expensive, especially if the expression contains a measure, because each measure reference causes context transition.
- Avoid callbacks. Functions that VertiPaq cannot evaluate inside a scan, such as some text functions or nested IF logic applied to every row, cause callbacks. Moving that logic into a column computed upstream often removes the callback.
Context transition and iterators
Context transition happens when a measure is referenced inside a row context, for example inside SUMX or a calculated column. The engine turns the current row into an equivalent filter context, which is what makes CALCULATE and measures work row by row. It is powerful and often necessary, but it has a cost: for each row of the iterated table the engine evaluates the measure under a new filter. Over 23 stores that is cheap. Over 41 million sales lines it can be very slow, and it can also give wrong results if the iterated table has duplicate rows, because the transition filters on all columns of the row.
Worked problem
Choosing what to iterate
A measure must compute the average margin per store across the stores in the current selection. One version iterates fact_sales and sums margin divided by the store count for each line; another iterates VALUES(dim_store[StoreKey]) and averages [Gross Margin]. With 41.2 million fact rows and 23 stores selected, how many evaluations of the inner expression does each version need?
Show solution
- Iterating fact_sales evaluates the inner expression once per sales line: about 41,200,000 evaluations.
- AVERAGEX over VALUES(dim_store[StoreKey]) evaluates [Gross Margin] once per store: 23 evaluations, each answered by a fast storage engine scan.
- The ratio is 41,200,000 ÷ 23, almost 1.8 million times as many evaluations.
Answer: Iterate the 23 stores. The store version is both faster and clearer: AVERAGEX ( VALUES ( dim_store[StoreKey] ), [Gross Margin] ).
Measuring a measure
Marisol taught a routine for testing any measure in DAX Studio. Capture the query from Performance Analyzer, or write a small EVALUATE with SUMMARIZECOLUMNS that reproduces the visual. Clear the cache. Run the query with Server Timings on, and note the total, the formula engine and storage engine split, the number of storage engine queries and any callbacks. Change one thing. Clear the cache and run again. A difference of a few milliseconds is noise; a difference of a factor of two or more is real.
EVALUATE
SUMMARIZECOLUMNS (
    dim_store[StoreName],
    TREATAS ( { "FY2026 Q3" }, dim_date[FiscalQuarter] ),
    "Margin Pct", [Margin Pct],
    "Margin Pct vs Region", [Margin Pct vs Region]
)
DAX query view in Power BI Desktop and in the Fabric web experience is the quickest place to run such a query and check the numbers, and it can define a measure temporarily in the query with DEFINE MEASURE before changing the model. DAX Studio adds the timings and the query plan. The two are complementary: Keiko wrote and checked queries in DAX query view, then took the slow ones to DAX Studio.
| Server timings sign | What it usually means | First thing to try |
|---|---|---|
| Formula engine time much larger than storage engine time | Row-by-row logic or many small queries | Rewrite filters on columns; iterate smaller tables |
| Dozens or hundreds of storage engine queries | The measure is evaluated per item instead of in bulk | Remove context transition over large tables; use variables |
| CallbackDataID in an xmSQL query | VertiPaq called the formula engine for each row | Move the expression into an upstream column or simplify it |
| One very large storage engine query | A scan of a large, poorly compressed column | Revisit the model size work from lesson 1 |
The other measures
With the routine in place, Keiko and Rosa went through the rest of the margin pack's measures in the session. Margin Rank used RANKX over ALL(dim_store[StoreName]); that was already reasonable, but it repeated [Margin Pct] inside and outside the ranking, so Keiko moved it into a variable. A measure called Basket Count used DISTINCTCOUNT on ReceiptNumber, which is a fairly expensive operation on a high-cardinality column, but it was needed and ran in 300 milliseconds, within the target, so they left it. A measure that flagged stores below target used nested IF statements; Keiko rewrote it with SWITCH(TRUE(), ...), which made it readable but did not change the timing much, and she noted that in the log rather than claiming a win.
By the end of the session the store page took 1.9 seconds on the trial capacity. Marisol estimated, from the capacity rehearsal in MSAZ-311, that it would take somewhere between two and three seconds on the F16, close to the target. The remaining time was mostly in rendering visuals and in the size of the model, which incremental refresh would not change but aggregations might.
Variables and the order of evaluation
Most of the rewritten measures in Finance Margin used variables, and Marisol spent part of the session on why. A variable defined with VAR is evaluated once, in the filter context where it is defined, and its value is reused wherever it is referenced afterwards. That gives two benefits. The first is speed: an expression such as the regional margin, referenced twice in an IF, is computed once instead of twice. The second is clarity: each step of the calculation has a name, and a developer can return any one of them temporarily to check its value. Keiko used that trick when a result looked wrong, replacing the RETURN expression with a single variable to see what it held.
Variables also carry a trap that caught Rosa once. Because a variable is evaluated where it is defined, a later CALCULATE does not change its value. Rosa wrote a variable for the store's sales and then wrapped it in CALCULATE with a filter on the prior year, expecting the prior year's sales; the result was the current year's figure, unchanged. The fix was to put the CALCULATE inside the variable's definition, or to reference the measure rather than the variable. Marisol's summary was that variables are constants once defined, which is what makes them fast.
Before any measure went into the shared model, the team agreed four checks. It returns the right number for at least three hand-checked cases, one of them with the slicers that finance uses most. It handles blanks and division by zero, normally with DIVIDE. Its server timings for the busiest visual are recorded in the change log. And it has a format string, a display folder and a description, which lesson 6 automates.
Common mistakes
MistakeFILTER(ALL(fact_table), ...) is the safe way to change a filter.
InsteadIt materializes every fact row; filter dimension columns with Boolean filters and REMOVEFILTERS instead.
MistakeA faster measure must give the same answer as the old one.
InsteadCheck the result; the old measure may have been wrong, as Margin Pct vs Region was.
MistakeAny measure under one second is fine, so stop measuring.
InsteadCompare against the target for the whole page; several half-second measures add up.
MistakeVariables are only for readability.
InsteadA variable is evaluated once and reused, which can also save work.
Summary and key terms
- Server timings in DAX Studio show the formula and storage engine split, the number of storage engine queries and callbacks.
- Row-by-row logic and many small storage engine queries are signs of a slow measure; callbacks show VertiPaq could not finish a scan alone.
- Filter dimension columns with Boolean filters and REMOVEFILTERS rather than FILTER over a fact table.
- Use variables, DIVIDE and iterators over small tables; avoid context transition over large tables.
- Test measures with a cold cache, one change at a time, and check that results are correct as well as fast.
- DAX query view is good for writing and checking queries; DAX Studio adds timings and query plans.
- Server timings
- A DAX Studio feature that records engine durations and storage engine queries for a DAX query.
- xmSQL
- The SQL-like text DAX Studio shows for each VertiPaq storage engine query.
- Callback
- A storage engine query that calls the formula engine for each row; shown as CallbackDataID.
- Context transition
- Turning a row context into a filter context, which happens when a measure is used in a row context.
- Boolean filter
- A simple filter condition on one column inside CALCULATE, such as Table[Column] = value.
- Cold cache
- Running a query after clearing the cache so that timings are comparable.
Practice problems
Work each problem on paper first, then reveal the answer to check.
What split in server timings suggests a row-by-row measure?
Show answer
Most of the time in the formula engine, with many storage engine queries.
What two problems did the old Margin Pct vs Region measure have?
Show answer
It filtered every fact row with RELATED, causing callbacks, and it ignored the date slicer.
How did the rewrite keep the date slicer working?
Show answer
It removed only the store filter and added a filter on the region column, leaving date filters untouched.
Why is AVERAGEX over VALUES(dim_store[StoreKey]) cheaper than iterating the fact table?
Show answer
It evaluates the measure 23 times instead of about 41 million times.
Where did Keiko write and check queries before timing them?
Show answer
In DAX query view.
Lesson quiz · 5 questions
Score 60% or more to complete this lesson.
Create a free account to save your progress, take quizzes and earn a certificate.