
MSAZ-312 · Lesson 6 of 12 · 20 min
External tools for modelling
▶ Video coming soon A video version of this lesson is on the way.
On Wednesday, November 4, Rosa needed to add three measures and change a format string in Finance Margin without republishing from Desktop, which lesson 4 had ruled out. Marisol used the session to tour the tools that analytics engineers use alongside Power BI Desktop. The DP-600 outline names two of them directly, DAX Studio and Tabular Editor 2, and expects candidates to know what each is for. Marisol added a third, ALM Toolkit, because it solved Rosa's problem most safely.
Why external tools exist
Power BI Desktop is where most models are built, and it has grown many features that once needed other tools: calculation groups, the TMDL view, DAX query view and model explorer. But it is a single-user design tool that works on a local copy. Some jobs are easier elsewhere: editing many objects at once, applying the same change to dozens of measures with a script, comparing two versions of a model, measuring queries in detail, or changing a model that lives in the service. External tools fill those gaps. Most connect through the XMLA endpoint to models in the service, or to the local Analysis Services instance that Power BI Desktop runs in the background.
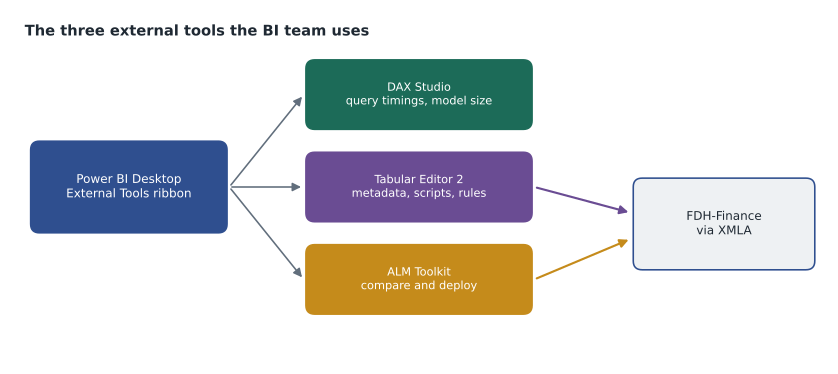
Desktop has an External Tools ribbon that lists installed tools that have registered themselves, so that a tool opens already connected to the model in the current file. Registration is done by a small JSON file that each tool installs. Organizations can control which tools staff may install, and Harrow & Finch's IT team had approved DAX Studio, Tabular Editor 2 and ALM Toolkit for the BI team in October.
DAX Studio
DAX Studio is a free tool for writing, running and analysing DAX queries. Lesson 2 used its main features: Server Timings, which splits a query's time between the formula and storage engines and lists storage engine queries; the query plan; clearing the cache; and capturing queries from a connected report with All Queries. Lesson 1 used View Metrics, its VertiPaq Analyzer view, to find large columns. It can also export the results of a query to a file, which the finance team found useful for one-off extracts that would otherwise have been built as a table visual with a hundred thousand rows.
The DP-600 outline describes DAX Studio as the tool for improving DAX performance, and that is how the team used it: not to write models, but to understand why a query is slow and to prove that a change helped. It needs only read access, so it works through the read-only XMLA endpoint and against Desktop.
Tabular Editor 2
Tabular Editor 2 is a free, open-source editor for the metadata of tabular models: tables, columns, measures, relationships, roles, perspectives, calculation groups and their properties. It shows the model as a tree and lets the user change many objects at once, for example setting the format string or display folder of every measure in a folder in one step. It does not load data; it edits the definition, which makes it fast even for very large models. A commercial product, Tabular Editor 3, adds a richer interface and more features; the exam outline names version 2, the free one.
Three features made it central to the team's work. The first was editing a model in the service directly through read-write XMLA, which is how Rosa added her three measures: she connected Tabular Editor to Finance Margin in FDH-Finance, added the measures, checked their syntax, and saved, which wrote only the metadata change. The partitions and data were untouched. The second was scripting. Tabular Editor runs C# scripts against the model, which can, for example, create a year-to-date and prior-year version of every base measure, or add descriptions from a list.
// Tabular Editor 2 script: give every measure in the "Margin" folder
// a number format and a description if it has none.
foreach (var m in Model.AllMeasures.Where(x => x.DisplayFolder == "Margin")) {
    if (m.Name.EndsWith("Amount")) m.FormatString = "#,0";
    if (string.IsNullOrEmpty(m.Description))
        m.Description = "Margin measure; see the Finance Margin model guide.";
}
The third was the Best Practice Analyzer, a rule engine inside Tabular Editor that checks a model against a set of rules and lists violations. Rules cover performance, such as columns that should not be summarized, relationships to columns with floating-point types, or calculated columns that could be measures; DAX expressions, such as using DIVIDE or avoiding IFERROR; naming and formatting, such as measures without format strings; and maintenance, such as objects without descriptions. Microsoft has published a widely used set of rules for Power BI models, and teams usually adopt it and then add or switch off rules to suit their standards.
| Best Practice Analyzer rule (examples) | Category | What the team did |
|---|---|---|
| Avoid floating-point data types | Performance | Changed two cost columns to fixed decimal |
| Set IsAvailableInMdx to false on non-attribute columns | Performance | Applied to 14 hidden key and amount columns |
| Use the DIVIDE function for division | DAX | Rewrote 6 measures |
| Provide a format string for measures | Formatting | Fixed 11 measures with the script above |
| Objects should have descriptions | Maintenance | Added descriptions to 40 measures over two weeks |
| Remove auto date/time tables | Performance | Already done in lesson 1 |
Running the analyzer on Finance Margin listed 71 violations. Most were quick formatting fixes; a few, like the floating-point cost columns, were real performance issues that lesson 1 had missed. Marisol's advice was to treat the rule list as a conversation starter, not a score: some rules are not worth following for every model, and switching one off with a recorded reason is better than ignoring it silently.
ALM Toolkit
ALM Toolkit compares two models, for example the version in a developer's Desktop file and the version in the service, and lists the differences object by object: a new measure, a changed expression, a deleted column. The user selects which differences to apply, and the tool deploys only those through the XMLA endpoint. For a model with incremental refresh this is the key benefit: the measures and other metadata change, while the partitions and their data stay in place. It also produces a script of the changes, which went into the change log.
Rosa's workflow from then on was to make changes in her Power BI project in Desktop, commit them to Git, compare the project with the service model in ALM Toolkit, deploy the selected differences, and refresh only if a change needed new data. Marisol noted that Fabric deployment pipelines, covered in lesson 10, can also move model changes between stages without losing data, and that the team would use pipelines for the stage-to-stage path and ALM Toolkit for targeted fixes.
Worked problem
Choosing a tool
Four jobs: (a) find out why one visual's query takes 4 seconds; (b) add a description to 40 measures; (c) deploy two new measures to a model with incremental refresh in production; (d) see which columns use the most memory. Which tool fits each best?
Show solution
- (a) is about query performance: DAX Studio with server timings.
- (b) is a bulk metadata change: Tabular Editor 2, by hand or with a script.
- (c) must change metadata without replacing data: ALM Toolkit, comparing the project with the service model and deploying only the differences, or Tabular Editor connected through XMLA.
- (d) is about model size: DAX Studio's VertiPaq Analyzer view, View Metrics.
Answer: DAX Studio for (a) and (d), Tabular Editor 2 for (b), ALM Toolkit for (c).
Working with model files as text
The Tabular Model Definition Language (TMDL) describes a semantic model as a folder of readable text files: one file per table with its columns, measures and partitions, and files for relationships, roles and other objects. Power BI projects can store the semantic model in TMDL, and Desktop has a TMDL view where developers can view and edit the model's definition as text and apply it. Because each object is a few lines of text, a Git diff shows exactly what changed in a pull request, which is why the hub's repository stored both models as Power BI projects. Tabular Editor can also open and save models in TMDL folders.
measure 'Margin Pct vs Region' =
        VAR StoreMargin = [Margin Pct]
        VAR CurrentRegion = SELECTEDVALUE ( dim_store[Region] )
        VAR RegionMargin =
            CALCULATE ( [Margin Pct], REMOVEFILTERS ( dim_store ), dim_store[Region] = CurrentRegion )
        RETURN
            IF ( NOT ISBLANK ( StoreMargin ), StoreMargin - RegionMargin )
    formatString: 0.000
    displayFolder: Margin
Notebooks as a modelling tool
Fabric adds another option. Semantic link, available by default in Fabric's Spark runtimes, lets a notebook read a semantic model's tables and measures into a FabricDataFrame and run DAX against it. A separate open-source library, semantic link labs, adds functions for tasks such as running Best Practice Analyzer rules and VertiPaq Analyzer statistics from a notebook. Marisol liked this for checks that should run on a schedule across many models, such as listing every model in the hub's workspaces with its size and rule violations each Monday. She told the group to confirm the library's function names against its documentation, because it changes often.
| Tool | Cost | Connects to | Best for |
|---|---|---|---|
| DAX Studio | Free | Desktop or XMLA (read) | Query timing, query plans, model size |
| Tabular Editor 2 | Free, open source | Desktop, XMLA (read-write), files | Bulk metadata edits, scripts, Best Practice Analyzer |
| Tabular Editor 3 | Commercial | Same as version 2 | A fuller development environment |
| ALM Toolkit | Free | Desktop, XMLA, files | Comparing models and deploying differences |
| Semantic link and semantic link labs | Included or open source | Models from Fabric notebooks | Scheduled checks across many models |
Setting the tools up for a team
Installing three tools on four laptops sounds simple, but Marisol had seen it go wrong. Different versions of the same tool behave slightly differently, and a Best Practice Analyzer rule file kept on one person's laptop is not a team standard. So the hub's repository got a tools folder with three things in it: the approved version of each tool, noted in a short readme; the team's Best Practice Analyzer rules as a JSON file, starting from Microsoft's published set with six rules switched off and the reason for each written beside it; and the C# scripts the team used often, such as the formatting script above. Tabular Editor can load rules from a file path or a URL, so every developer pointed it at the same file.
Keiko asked whether Power BI Desktop had caught up enough to make DAX Studio unnecessary. Desktop's DAX query view can now write and run EVALUATE queries against the open model, and Performance Analyzer can copy a visual's query straight into it, so for simple questions Desktop is enough. What it does not give is DAX Studio's split of time between the formula engine and the storage engine, the list of storage engine queries, or VertiPaq Analyzer's size statistics, and those were exactly what lessons 1 and 2 had relied on. The team kept both: DAX query view for checking a result quickly while building, DAX Studio for finding out why something is slow.
Rosa asked the last question of the session: what if one of the free tools stopped being maintained? Marisol pointed out that the team's real assets were the model definitions in TMDL and the rule file, both plain text in Git. Any tool that reads TMDL can open the models, and the rules are documented in the file itself. Choosing tools that work on open, text-based formats was the best insurance against any single tool changing.
Common mistakes
MistakeTabular Editor loads the model's data, so it is slow on large models.
InsteadIt edits metadata only and is fast at any size.
MistakeDAX Studio needs read-write XMLA to time queries.
InsteadQuerying and timing need read-only access.
MistakeBest Practice Analyzer violations must all be fixed.
InsteadFix the ones that matter, and switch off rules that do not suit the model with a recorded reason.
MistakeTo change one measure in production, republish the PBIX.
InsteadFor models with incremental refresh, deploy the metadata change with ALM Toolkit, Tabular Editor or a deployment pipeline.
Summary and key terms
- External tools connect to Desktop's local engine or to models in the service through the XMLA endpoint.
- DAX Studio measures queries: server timings, query plans and VertiPaq Analyzer; it needs read-only access.
- Tabular Editor 2 edits model metadata, runs C# scripts and hosts the Best Practice Analyzer.
- ALM Toolkit compares two models and deploys only selected differences, keeping partitions and data.
- TMDL stores a model as readable text files that work well with Git diffs.
- Semantic link and semantic link labs let notebooks query models and run checks on a schedule.
- External Tools ribbon
- The Power BI Desktop ribbon that opens registered tools connected to the current model.
- Tabular Editor 2
- A free, open-source editor for tabular model metadata, with scripting and Best Practice Analyzer.
- Best Practice Analyzer
- A rule engine that checks a model against performance, DAX, formatting and maintenance rules.
- ALM Toolkit
- A free tool that compares two tabular models and deploys selected differences.
- TMDL
- Tabular Model Definition Language, a text format that describes a semantic model as files.
- Semantic link
- A Fabric feature that connects notebooks to semantic models and their measures.
Practice problems
Work each problem on paper first, then reveal the answer to check.
Which two external tools does the DP-600 outline name?
Show answer
DAX Studio and Tabular Editor 2.
How did Rosa add measures without replacing Finance Margin's data?
Show answer
She edited the model through read-write XMLA with Tabular Editor, and later deployed changes with ALM Toolkit.
Why is TMDL useful with Git?
Show answer
Each object is a few lines of text, so diffs show exactly what changed.
What did Marisol say about Best Practice Analyzer violations?
Show answer
Treat them as a conversation starter; fix what matters and record reasons for rules you switch off.
What did Marisol want to run from notebooks?
Show answer
Scheduled checks across all models, such as size and rule violations.
Lesson quiz · 5 questions
Score 60% or more to complete this lesson.
Create a free account to save your progress, take quizzes and earn a certificate.