
MSAZ-312 · Lesson 8 of 12 · 20 min
Report performance
▶ Video coming soon A video version of this lesson is on the way.
By Friday, November 6 the models were faster, but Rosa reported that the margin pack's overview page still took more than eight seconds to appear. Marisol was not surprised. A report page is a set of visuals, and each visual sends its own query, draws its own result and waits its turn. A fast model can still sit behind a slow page if the page asks for too much at once. This session was about the report layer: how to measure a page, what makes visuals slow, and which design changes help.
Measuring a page with Performance Analyzer
Performance Analyzer is a pane in Power BI Desktop, opened from the Optimize ribbon. When recording, it logs every visual on the page each time it renders: when the user opens the page, changes a slicer or cross-filters. For each visual it shows the total duration and splits it into parts. DAX query is the time from sending the query to receiving the result, which is the model's work. Visual display is the time the visual takes to draw the result, which grows with the number of data points and the complexity of the visual. Other is time the visual spent waiting, mostly for other visuals ahead of it, since a page renders a limited number of visuals' queries at a time. For DirectQuery and composite models a Direct query line shows time spent at the source.
Keiko opened the overview page with the cache cleared, recorded one load, and exported the log, which Performance Analyzer saves as a JSON file. The page had 31 visuals: 14 cards, 6 slicers, 4 charts, 3 tables, 2 shapes with text, a map and an image. Rosa had built it over three years, adding a card each time someone asked for a number.
| Visual group | Count | DAX query (ms, total) | Visual display (ms, total) | Other (ms, total) |
|---|---|---|---|---|
| Cards | 14 | 1,960 | 420 | 9,310 |
| Slicers | 6 | 1,140 | 510 | 3,020 |
| Charts | 4 | 880 | 760 | 1,450 |
| Tables | 3 | 1,420 | 2,180 | 960 |
| Map | 1 | 310 | 1,340 | 640 |
| Shapes and image | 3 | 0 | 90 | 120 |
The table told the story. The model's share, the DAX query column, was modest: no single query took more than 600 milliseconds. Most of the time was in the Other column, waiting, and most of the waiting was caused by the sheer number of visuals. The cards waited longest because they were near the bottom of the page's rendering order. The tables and the map spent their time drawing. The page took 8.2 seconds before the last visual appeared.
# Summarize an exported Performance Analyzer log (simplified)
visuals = [
    # (name, dax_ms, display_ms)
    ("Store margin table", 590, 1460), ("Region chart", 240, 210),
    ("Map", 310, 1340), ("Product table", 520, 980),
    ("Sales card", 140, 30), ("Margin card", 150, 30),
    ("Shrink card", 130, 30), ("Supplier slicer", 380, 220),
]
for name, dax, disp in sorted(visuals, key=lambda v: v[1] + v[2], reverse=True)[:3]:
    print(f"{name:20}{dax + disp:>6} ms  (query {dax}, display {disp})")

total_query = sum(v[1] for v in visuals)
total_display = sum(v[2] for v in visuals)
print("Query time:", total_query, "ms; display time:", total_display, "ms")Store margin table 2050 ms (query 590, display 1460) Map 1650 ms (query 310, display 1340) Product table 1500 ms (query 520, display 980) Query time: 2460 ms; display time: 4300 ms
What this code does
The block lists a few visuals from the exported log, each with the time its query took and the time it took to draw. It sorts them by the two added together and prints the three most expensive, then adds up query time and drawing time across the list so the team can see whether the model or the visuals themselves cost more on this page.
The three costliest visuals in Keiko's sample were the store margin table, the map and the product table, and all three spent more time drawing than querying. The store margin table had 23 rows, one per store, but 14 columns, with conditional formatting on six of them. The map plotted every store with a bubble and a tooltip page. The product table showed the top products by margin, but it was set to show all products, more than 48,000 rows, with a scroll bar.
What makes a page slow
Marisol listed the usual causes, in the order she checks them. Too many visuals on one page comes first, because each one adds a query, a render and a turn in the queue. Visuals with many data points come second: tables with thousands of rows, scatter charts with tens of thousands of points, maps with many locations. Third are expensive measures, which lessons 1 and 2 dealt with. Fourth are slicers on high-cardinality columns, such as a slicer listing every product, which has to load the whole list before it can draw. Fifth are cross-filtering interactions: by default, selecting a point in one visual re-queries every other visual on the page. Last come custom visuals from outside Microsoft, which vary widely in how well they perform.
The redesign
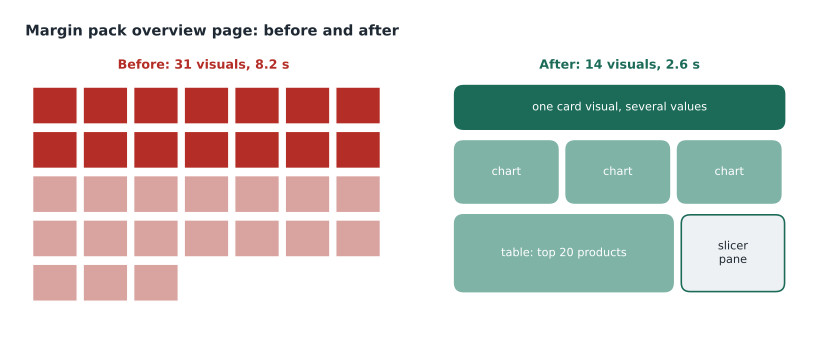
Rosa and Keiko made the changes over the session, re-recording after each one so they could see what each change bought. They replaced the 14 cards with a single card visual that shows several values in one visual. The newer card visual in Power BI can display many measures with their labels, so the page lost 13 visuals and 13 queries; the card's one query returned all the values together. They moved four rarely used slicers into a slicer pane that opens with a button, and changed the remaining slicers so that they apply only when the user selects Apply, using the query reduction options in the report settings. That meant that choosing three regions caused one round of queries, not three.
They limited the product table to the top 20 products by margin with a Top N filter, and added a drill-through page for anyone who needed the full list. They turned off conditional formatting on four of the six store table columns, after Rosa asked finance which colours they actually looked at. They replaced the bubble map with a filled shape of the regions coloured by margin, which needed far fewer points. The logo image stayed, because it cost almost nothing. Finally, they edited the interactions so that selecting a region in the chart filtered the store table and the card but not the slicers or the trend chart, which nobody needed to change.
| Change | Visuals | Page load (s) |
|---|---|---|
| Start | 31 | 8.2 |
| 14 cards replaced by one card visual | 18 | 5.1 |
| Slicer pane and Apply button | 14 | 4.3 |
| Top 20 products with drill-through | 14 | 3.4 |
| Simpler map and fewer formatting rules | 14 | 2.9 |
| Edited interactions | 14 | 2.6 |
Worked problem
How much did the cards cost?
In the first recording the 14 cards together had 1,960 ms of query time and 420 ms of display time. After the change, the single card visual took 190 ms to query and 60 ms to draw. How many milliseconds of query and display work did the change remove, and why did the page get faster by more than that?
Show solution
- Work before: 1,960 + 420 = 2,380 ms.
- Work after: 190 + 60 = 250 ms.
- Removed: 2,380 − 250 = 2,130 ms of query and display work.
- The page got 3.1 seconds faster (8.2 to 5.1) because 13 fewer visuals also meant less waiting: the other visuals no longer queued behind the cards.
Answer: About 2.1 seconds of work, plus most of the time other visuals had spent waiting in the queue.
Testing in the service
Desktop is a good place to compare designs, but it is not where users see the report. Marisol insisted on a test in the service as well, because the browser, the network and the capacity all add time and the service caches results. She published the report to the FDH-Finance workspace and asked Rosa to open the page in a private browser window, so that nothing was cached in the browser, and to time it from the click to the last visual. It took 3.0 seconds on the trial capacity. Opening it again took 1.2 seconds, because the service had cached the query results for the visuals. She also showed the group the browser's developer tools, where the network tab lists each query the page sends, but said Performance Analyzer was usually enough.
Two further features help in the service. For reports on import models, a dashboard tile or the report's query cache can serve common views from stored results; for Premium and Fabric capacities, query caching is a setting on the semantic model that, when on, keeps the results of the initial page loads. And for pages that users open first, reducing the number of visuals on the landing page matters most, because nobody has filtered anything yet and every visual runs at its widest scope.
Design rules the team adopted
- Aim for no more than about 15 visuals on a page, counting cards, slicers and shapes; use a multi-value card instead of many single cards.
- Show summaries first and details on drill-through pages, tooltips or a second page.
- Limit tables to a sensible number of rows with Top N filters; nobody reads 48,000 rows on screen.
- Use the Apply button for slicers on pages with several slicers, and put rarely used ones in a pane.
- Edit interactions so that visuals filter only what a user would expect them to.
- Prefer built-in visuals; test any custom visual with Performance Analyzer before adopting it.
- Record the page before and after every change, with the cache cleared, and keep the numbers in the change log.
Rosa asked whether some of this would make the page less useful. Marisol said it was the right question to ask finance, not the BI team. They showed Dana the new page and the old one side by side, and she pointed out that one of the removed cards, shrink as a share of sales, was used every month. It went back into the card visual at no extra cost. Optimization, Marisol said, is a design conversation with the people who use the page, not just a stopwatch.
Optimize ribbon features
Desktop's Optimize ribbon has a few other tools worth knowing. Pause visuals stops visuals from querying while a developer changes the page, which helps when editing a slow report over DirectQuery, and a refresh button then runs them once. Optimization presets apply groups of settings at once: one preset favours fewer queries, turning on Apply buttons and turning off cross-highlighting, another favours interactivity, and a custom option lets the developer choose. Keiko used the query reduction preset as a starting point for the finance reports and then turned cross-filtering back on where it mattered.
Pages for store managers
Grace Oduya's store managers would use Sales Overview on store tablets, not on desktop screens, so Keiko repeated the exercise for its store page with a tablet-sized browser window. The page had 16 visuals, close to the team's limit, but the tablet's slower processor made visual display time matter more than on a laptop: the same table that drew in 300 milliseconds on Keiko's laptop took about 700 on the test tablet. She built a mobile layout for the page, which Power BI shows on phones, and on the tablets she replaced a 30-row product table with a bar chart of the top 10 products, which drew in a third of the time. Grace asked for one more thing: a clear date at the top of the page saying which day's data the store manager was looking at, because the reframe happened at 6:10 a.m. and an early-shift manager might open the report before then. The card that showed it cost 40 milliseconds and saved, in Grace's words, a lot of phone calls.
Common mistakes
MistakeA slow page means the model needs tuning.
InsteadCheck Performance Analyzer first; time spent waiting or drawing points to the report design, not the model.
MistakeMore cards make a page easier to read.
InsteadEach card is a visual with its own query; a multi-value card shows the same numbers with one query.
MistakeA table should show every row so nothing is hidden.
InsteadShow a Top N and offer drill-through for details.
MistakeTesting in Desktop is enough.
InsteadTest in the service too, with an empty browser cache, because the browser, network and capacity add time.
Summary and key terms
- Performance Analyzer splits each visual's time into DAX query, visual display, other (waiting) and, for DirectQuery, direct query.
- Many visuals on one page cause long waits, because a page runs a limited number of queries at a time.
- Visuals with many data points, high-cardinality slicers and cross-filter interactions also slow pages.
- Combine cards, move slicers into a pane with an Apply button, limit tables with Top N and edit interactions.
- Test in the service with an empty cache as well as in Desktop.
- Optimization changes the design, so agree them with the report's users.
- Performance Analyzer
- A Power BI Desktop pane that logs each visual's query, display and waiting time.
- Visual display time
- The time a visual takes to draw its result.
- Other time
- Time a visual spends waiting, mostly for other visuals ahead of it.
- Query reduction
- Report settings that reduce queries, such as Apply buttons for slicers and filters.
- Edit interactions
- A setting that controls which visuals a selection filters or highlights.
- Optimization presets
- Groups of report settings on the Optimize ribbon that favour fewer queries or more interactivity.
Practice problems
Work each problem on paper first, then reveal the answer to check.
Which Performance Analyzer column grew with the number of visuals on the page?
Show answer
Other, the waiting time.
How many visuals did the overview page have before and after?
Show answer
31 before and 14 after.
Why did replacing 14 cards save more time than their own query and display work?
Show answer
The other visuals no longer waited behind them.
How should a page be tested in the service?
Show answer
In a private window with an empty cache, timed from click to the last visual.
Which removed card came back, and why?
Show answer
Shrink as a share of sales, because finance used it every month.
Lesson quiz · 5 questions
Score 60% or more to complete this lesson.
Create a free account to save your progress, take quizzes and earn a certificate.