
MSAZ-312 · Lesson 3 of 12 · 21 min
Aggregations and composite models
▶ Video coming soon A video version of this lesson is on the way.
On Friday, October 30, Dana Whitcombe joined the tune session with a new request. Finance wanted margin trends over seven years, back to 2019, for a board presentation on the effect of the pandemic years and the two price increases since. The hub's warehouse held seven years of sales lines in an archive table, about 96 million rows, but importing them into Finance Margin would roughly double its size again. Marisol said this was exactly the case that composite models with aggregations are for: keep a small summary in memory for the questions most people ask, and send the rare detailed questions to the warehouse.
Composite models
A composite model is a semantic model that mixes storage modes: some tables in import or Direct Lake mode and others in DirectQuery, or tables in dual mode, which can act as either. MSAZ-311 covered the storage modes one at a time. The point of mixing them is that each table can use the mode that suits it. A small dimension can be imported; a huge detail table can stay in the source and be queried with DirectQuery; and a table that both sides need can be dual, so the engine uses its in-memory copy when the query is answered from memory and treats it as DirectQuery when the query goes to the source.
A second kind of composite model connects to other semantic models with DirectQuery. A report author can start from a shared model, add a local table or measure, and publish a new model that sends queries to the original. Lesson 9 returns to this pattern for reusable assets; this lesson is about the first kind, which mixes storage modes over a data source.
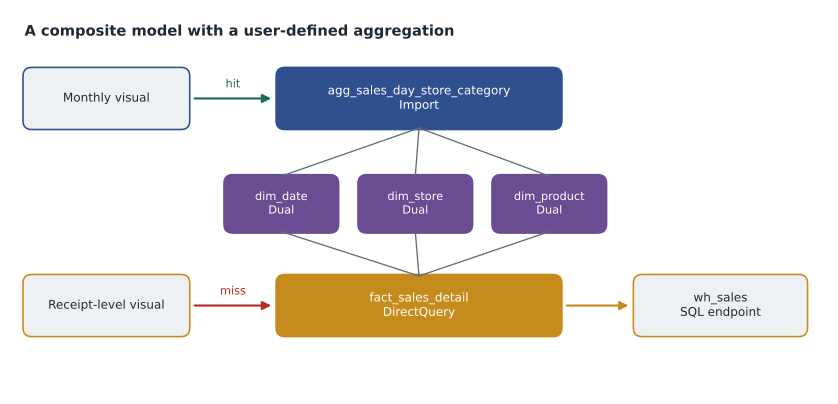
User-defined aggregations
An aggregation table is a summary of a detail table at a coarser grain, mapped to the detail table so that the engine can use the summary whenever a query asks for something the summary can answer. Users never see it. A report that sums net amount by month and region reads the aggregation; a report that lists individual receipts goes to the detail. The engine decides for each storage engine query, which is why a visual can be partly answered from each.
Power BI's rules for user-defined aggregations are specific, and the DP-600 outline expects candidates to know them. The detail table must use DirectQuery. The aggregation table should be import, created in Power Query; once set to import it cannot be changed back. Dimension tables that relate to both should be dual, so that relationships between the import aggregation and the dimensions are regular relationships rather than limited ones. Aggregations are configured in the Manage aggregations dialog, opened by right-clicking the aggregation table; for each summary column it sets a summarization, a detail table and a detail column, and when the settings are applied the aggregation table is hidden.
| Summarization | Maps a summary column to | Notes |
|---|---|---|
| Sum | A numeric detail column | The usual choice for amounts and quantities |
| Count | A detail column | The aggregation column must be an integer |
| Count table rows | The detail table itself | Lets COUNTROWS be answered from the summary; integer column |
| Min and Max | A detail column | For earliest, latest, smallest and largest values |
| GroupBy | A detail grouping column | Required in GroupBy-based aggregations; optional when relationships do the grouping, except for distinct counts |
There are two styles. In a relationship-based aggregation, the usual one in a star schema, the summary table has foreign keys to the same dimensions as the detail table, and the relationships tell the engine how the grain lines up. In a GroupBy-based aggregation, common with wide denormalized tables, the summary holds the grouping columns themselves and each must be mapped with GroupBy, or the aggregation is never used. A model can combine both. If several aggregation tables cover the same detail, the precedence property decides which is tried first; a higher number wins. Aggregations cannot be chained: every aggregation must map to the base detail table, not to another aggregation.
Designing the summary
Keiko started with the questions. The board pack showed margin by fiscal month, region and product category; the finance team's monthly drill-down went to store and day; only the audit team ever needed individual receipts. A summary at day by store by category would answer the first two and leave the third to DirectQuery.
# Size of a day x store x category aggregation over seven years
days = 2557            # Jan 1, 2019 to Dec 31, 2025
stores = 23
categories = 38
populated_share = 0.953   # not every store sells every category every day

max_rows = days * stores * categories
agg_rows = round(max_rows * populated_share)
detail_rows = 96_000_000

print("Possible combinations:", f"{max_rows:,}")
print("Rows in the summary:  ", f"{agg_rows:,}")
print("Detail rows per summary row:", round(detail_rows / agg_rows, 1))Possible combinations: 2,234,818 Rows in the summary: 2,129,782 Detail rows per summary row: 45.1
What this code does
The block multiplies the number of days, stores and product categories in seven years of sales to get every possible combination, then keeps only the share that actually had sales. It prints the number of rows the summary table would hold and how many detail sales lines each summary row stands for on average, which shows how much smaller and faster the summary is than the detail table.
The summary would hold about 2.1 million rows, one for every 45 or so detail rows, and its columns would compress well because every one of them had low cardinality. Keiko built it as a T-SQL view in the warehouse first, so that its totals could be checked against the detail with a single query, then imported it with Power Query. The summary columns were DateKey, StoreKey, CategoryKey, NetAmount (Sum), Cost (Sum), Units (Sum) and LineCount (Count table rows).
Worked problem
Will this visual hit the aggregation?
Four visuals in the board pack: (1) net amount by fiscal month and region; (2) margin by store and day for one quarter; (3) units by product subcategory; (4) number of distinct receipts by month. Which can the day by store by category summary answer?
Show solution
- Visual 1 groups by fiscal month and region, both attributes of dim_date and dim_store, which relate to the summary through DateKey and StoreKey. It can be answered from the summary.
- Visual 2 groups by store and day, which are the summary's own grain, and margin is net amount minus cost, both summed. It can be answered from the summary.
- Visual 3 groups by subcategory, which is finer than category. The summary has no subcategory key, so the query goes to the detail table.
- Visual 4 is a distinct count of receipts. The summary has no ReceiptNumber column, so it cannot be answered from the summary; a distinct count needs the column itself as a GroupBy entry.
Answer: Visuals 1 and 2 hit the aggregation; visuals 3 and 4 go to the detail table in DirectQuery.
Checking that aggregations are used
A model can be configured correctly and still not use its aggregations, for example because a visual groups by a column that the summary does not cover. The way to check is to watch the engine. SQL Server Profiler, or the equivalent trace in DAX Studio, connected through the XMLA endpoint, shows the Aggregate Table Rewrite Query event. Its details say whether a subquery matched an aggregation, which columns it asked for and which summary columns they mapped to. A DirectQuery event for the same visual shows that it went to the source.
Keiko traced the board pack's eleven visuals with a cold cache. Nine hit the aggregation and returned in well under a second; the subcategory chart and the distinct receipts card went to the warehouse and took 2.4 and 3.1 seconds. Dana decided the subcategory chart could move to a drill-through page, and that the distinct receipt count could come from a second, smaller aggregation with ReceiptNumber as a GroupBy column at month by store grain, which Keiko added with a higher precedence. After that, the main pages were answered entirely from memory.
Rules that trip people up
Several rules from Microsoft's documentation caught the group during the session. Row-level security must filter both the aggregation table and the detail table; a role that filters only the aggregation is not allowed. Users with read access cannot query aggregation tables directly, which keeps the summary from bypassing security. A relationship that is inactive and activated with USERELATIONSHIP cannot be used to group an aggregation; TREATAS is the alternative. And if the detail table's source uses single sign-on, import aggregations over it are ignored, because a summary in memory cannot respect each user's own permissions in the source.
There was also a freshness question. The summary was imported, so it was as fresh as its last refresh; the detail table was DirectQuery, so it was always current. If the warehouse loaded new sales during the day, a visual answered from the summary and one answered from the detail could disagree. In the hub that was not a problem, because the warehouse was loaded once a night before the model refreshed, but Marisol wrote it down as a design assumption.
| Rule | Why it exists |
|---|---|
| Detail table in DirectQuery | Aggregations exist to avoid querying a large source; an imported detail would already be in memory |
| Dimensions in dual mode | So relationships to both the import summary and the DirectQuery detail are regular relationships |
| RLS on both summary and detail | Otherwise a user could see totals that their row filter should hide |
| No chained aggregations | Each summary maps to the base detail table so the engine can reason about it |
| Matching data types | Detail and summary columns must match, except for counts |
Automatic aggregations
Power BI also offers automatic aggregations for DirectQuery models on Premium and Fabric capacities. When turned on in the model's settings, the service watches the queries users run, trains a model of which summaries would help, and builds and refreshes aggregation tables in memory on a schedule. It suits models where usage is hard to predict or where nobody has time to design summaries by hand. Marisol preferred user-defined aggregations for the board pack, because its questions were known and she wanted to control exactly what was stored, but she noted automatic aggregations as an option for the ad hoc DirectQuery models that analysts built.
When not to use a composite model
Aggregations are not free. They add tables to maintain, rules to remember and a second path for every visual. If a model fits comfortably in memory, import or Direct Lake alone is simpler and fast. Finance Margin, at 831 MB for three years, did not need them. The seven-year history did, because its detail would have added about a gigabyte and a half of memory for questions that only the audit team asked at receipt level. Dana agreed to publish the history as a separate composite model, Finance History, rather than enlarge Finance Margin, so that the everyday model stayed small.
Maintaining the aggregation table
An aggregation table is only as good as its refresh. If the summary in import mode is refreshed at 6:30 a.m. but the detail in DirectQuery already holds the newest rows, a total from the summary and a drill-through to the detail can disagree for part of the morning. Dana saw exactly that in the second week: a quarter total on the history report differed by one day's sales from the sum of its store rows. The team fixed it by building the summary from the same warehouse table at the end of Ines Duarte's nightly load, in a view that the import table read, and by scheduling the model refresh after the load's completion signal instead of at a fixed time.
Marisol also asked for a simple reconciliation check. Each morning a notebook ran one DAX query that returned the seven-year sales total with the aggregation used and one SQL query that summed the detail directly in the warehouse, and it compared the two to the cent. Any difference sent a message to the BI team's channel. In the first three weeks it found one gap, caused by a manual correction in the warehouse after the refresh, and the routine for such corrections now ends with a refresh of the summary.
Common mistakes
MistakeThe aggregation table can be in DirectQuery mode like the detail.
InsteadThe detail must be DirectQuery; the aggregation should be import for performance.
MistakeOnce aggregations are configured, every visual uses them.
InsteadOnly queries the summary can answer hit it; trace the Aggregate Table Rewrite Query event to check.
MistakeA row-level security filter on the aggregation table is enough.
InsteadRLS must filter both the aggregation and the detail table.
MistakeA distinct count can always be answered from a summed summary.
InsteadDistinct counts need the column in the summary as a GroupBy entry.
Summary and key terms
- Composite models mix import or Direct Lake, DirectQuery and dual storage modes, or connect to other semantic models with DirectQuery.
- User-defined aggregations map an import summary to a DirectQuery detail table; dimensions should be dual.
- Manage aggregations sets each summary column's summarization, detail table and detail column; precedence orders several summaries.
- Relationship-based aggregations rely on dimension relationships; GroupBy-based ones need GroupBy entries.
- Trace the Aggregate Table Rewrite Query event to confirm that visuals hit the aggregation.
- RLS must cover both tables, chains are not allowed, and SSO sources disable import aggregations.
- Composite model
- A semantic model that mixes storage modes or connects to other semantic models with DirectQuery.
- Dual mode
- A storage mode in which a table acts as import or DirectQuery depending on the query.
- Aggregation table
- A hidden summary table mapped to a detail table so the engine can answer queries from it.
- Precedence
- The aggregation property that decides which of several aggregation tables is tried first.
- Aggregation hit
- A storage engine query answered from an aggregation table rather than the detail table.
- Automatic aggregations
- A capacity feature that builds and maintains aggregations based on observed queries.
Practice problems
Work each problem on paper first, then reveal the answer to check.
Which storage mode must the detail table of a user-defined aggregation use?
Show answer
DirectQuery.
Why are dimension tables set to dual in an aggregation design?
Show answer
So their relationships to both the import summary and the DirectQuery detail are regular relationships.
Why did the subcategory chart miss the aggregation?
Show answer
The summary was at category grain and had no subcategory key.
How can you confirm an aggregation hit?
Show answer
Trace the Aggregate Table Rewrite Query event with SQL Server Profiler or DAX Studio through the XMLA endpoint.
Why did Dana publish Finance History separately?
Show answer
So the everyday Finance Margin model stayed small while the rarely used seven-year detail stayed in DirectQuery.
Lesson quiz · 5 questions
Score 60% or more to complete this lesson.
Create a free account to save your progress, take quizzes and earn a certificate.