
MSAZ-312 · Lesson 12 of 12 · 20 min
An enterprise analytics case study
▶ Video coming soon A video version of this lesson is on the way.
The last tune session, on Friday, November 13, was a review. Marisol asked Keiko to present the whole piece of work to Dana Whitcombe and Elena Brandt as if they had missed every session: what was wrong, what the team changed, what it proved, and what would happen next. Rosa and Nikolai came to check the numbers. Marisol's instruction was the same as her rule for modelling in MSAZ-311, applied to a different audience: decide the question before the tool, and here the question was whether finance's models were ready for the pilot on the F16 from January 4, 2027.
This lesson follows Keiko's presentation. It is also a way to see how the skills in the course fit together, because real performance work rarely touches one layer. A slow page in October had causes in the model's size, its DAX, its refresh design, the report layout and the way people shared and copied models, and each fix depended on another.
The starting point
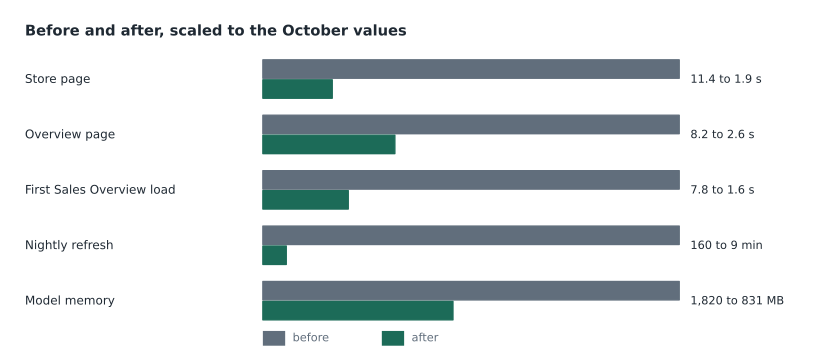
Keiko began with the state of things on October 27. Finance Margin was a 1,820 MB import model, loaded every night from StockLine through the on-premises gateway in 2 hours and 40 minutes. Its store page took 11.4 seconds, and the margin pack's overview page 8.2 seconds. One measure, Margin Pct vs Region, ignored the date slicer and was off by up to 0.6 points. Finance History answered seven years of questions in DirectQuery with no aggregations. Five analysts held 17 private copies of the model in their own files. And none of the models had been checked against the guardrails of the capacity they would run on in January.
| Area | Before (October 27) | After (November 13) | Lesson |
|---|---|---|---|
| Finance Margin memory | 1,820 MB | 831 MB | 1 |
| Store page, trial capacity | 11.4 s | 1.9 s | 1–2 |
| Margin Pct vs Region | Wrong with a date filter | Correct; 210 ms query | 2 |
| Finance History visuals using an aggregation | None | 11 of 11 | 3 |
| Nightly refresh of Finance Margin | 2 h 40 min | 9 min | 4 |
| Sales Overview first load after reframe | 7.8 s | 1.6 s | 7 |
| Margin pack overview page | 8.2 s, 31 visuals | 2.6 s, 14 visuals | 8 |
| Private copies of the finance model | 17 | 0 | 9 |
How the fixes depended on each other
Keiko made the point that the order had mattered. Shrinking the model in lesson 1 came first because every later measurement would have been distorted by a model twice the size it needed to be. The DAX fixes in lesson 2 came next, but they were only possible to judge with server timings, which only make sense once the storage engine has less to scan. Incremental refresh in lesson 4 depended on Rosa moving the source to the warehouse, which removed the gateway and made the filter fold. And it changed how the model could be maintained: republishing was ruled out, which made the large format, the XMLA endpoint, read-write access and the external tools of lessons 5 and 6 necessary rather than optional.
In the same way, lesson 9's shared model was only safe once lesson 10's impact analysis and deployment pipeline were in place, because a change to a shared measure reaches every thin report at once. And lesson 11's certification checklist was really a list of everything the earlier lessons had done: descriptions, rules, tested security, refresh notifications, reconciliation and Git. Dana said that was the most useful thing she had heard, because it meant certification was evidence, not a badge.
Is it ready for the F16?
Elena's question was about capacity. The pilot's F16 has 16 capacity units, a quarter of the trial's 64, and serves 140 readers: 69 store managers and 71 head office staff. Keiko used figures from the capacity metrics app on the trial capacity, where Fabric measures work in capacity unit seconds, to estimate the busiest hour. The morning peak was from 8:00 to 9:00 a.m., when store managers opened Sales Overview and finance opened the margin pack.
# Busiest-hour estimate for the F16 pilot
cu = 16
cu_seconds_per_hour = cu * 3600

readers = 140
views_per_reader = 6            # page views in the peak hour, from the trial
cu_s_per_view = 3.2             # average interactive cost per page view on the trial
interactive = readers * views_per_reader * cu_s_per_view

refresh_cu_s = 1900             # one Finance Margin incremental refresh
background_per_hour = refresh_cu_s / 24   # background work is spread over 24 hours

used = interactive + background_per_hour
print("Capacity per hour:", f"{cu_seconds_per_hour:,}", "CU seconds")
print("Interactive use in the peak hour:", f"{interactive:,.0f}")
print("Background share per hour:", round(background_per_hour))
print("Share of the hour used:", round(used / cu_seconds_per_hour * 100, 1), "in 100")Capacity per hour: 57,600 CU seconds Interactive use in the peak hour: 2,688 Background share per hour: 79 Share of the hour used: 4.8 in 100
What this code does
The block works out how many capacity unit seconds an F16 provides in one hour. It estimates the interactive load in the busiest hour from the number of readers, their page views and the average cost of a page view measured on the trial, then adds an hour's share of the nightly refresh, since background work is spread over a day. The last line shows what part of the hour that load would use.
The estimate came to about 4.8 in every 100 capacity unit seconds of the peak hour. Keiko was careful to say what it did not show. Capacity is not consumed evenly: a single heavy query or a burst of page loads at 8:00 a.m. can briefly use far more than the average, and Fabric smooths interactive work over minutes rather than an hour, so the average hid the peaks. And 3.2 capacity unit seconds per page view had been measured after the tuning, on the trial, with its larger memory. The estimate said the F16 had room; the rehearsal would say whether the peaks fit.
She also checked memory. On the F16, each semantic model can use up to 5 GB of memory. Finance Margin used 831 MB, with up to about 1.7 GB during a full refresh, which incremental refresh made rare. Sales Overview used about 2.0 GB resident on a full walk-through after the column removals in lesson 7. Finance History's import aggregations were small and its detail stayed in DirectQuery. Each model fitted on its own, which is what the limit measures, and the guardrails for files, rows and model size were years away.
Worked problem
Reading the headroom
Using Keiko's figures, how many page views in the peak hour would it take for interactive work alone to use half of the F16's capacity unit seconds for that hour, and how many views per reader is that?
Show solution
- Half the hour: 57,600 ÷ 2 = 28,800 capacity unit seconds.
- Views at 3.2 each: 28,800 ÷ 3.2 = 9,000 page views.
- Per reader: 9,000 ÷ 140 = 64.3 views in the hour.
- The pilot expects about 6 per reader, so the average is not the risk; short bursts are.
Answer: About 9,000 page views, or roughly 64 per reader in the hour, more than ten times the expected use.
The plan
Keiko's last slide was the plan, agreed with Elena and Dana. Everything on it was in the future as of the review.
| When | What | Owner |
|---|---|---|
| November 19, 2026 | Rename DiscountAmt and drop TillNote in wh_sales, after the notification of November 10 | Ines |
| From November 23, 2026 | Weekly Best Practice Analyzer and usage check from the semantic link notebook | Keiko |
| To December 18, 2026 | Two-week rehearsal on the trial capacity with the F16 load simulated, including the 8:00 a.m. peak | Marisol and Elena |
| January 4, 2027 | Pilot starts on the F16 with 140 readers | Elena |
| February 2027 | Review of governance rules with the finance analysts; decide on Direct Lake on OneLake | Marisol |
| Quarterly from 2027 | Retire unused reports; review write access to production workspaces | Elena and Rosa |
The rehearsal had pass criteria written down before it started: the store page and the margin pack overview under 3 seconds for 95 of every 100 page loads during the peak hour; no throttling events in the capacity metrics app; every nightly refresh and reframe complete by 6:30 a.m.; and no fallback to DirectQuery, which the Direct Lake only setting would turn into visible errors. If any criterion failed, the team would tune again or ask for a larger capacity before January, with the numbers to justify it.
What the work showed
Marisol closed the review with three lessons of her own, and asked Keiko to add them to the hub's wiki. Measure before changing anything, and measure in the same way afterwards, because most of the team's guesses about what was slow had been wrong at least once. Fix the layer the time is spent in: storage, formulas, refresh or the page, not the one that is easiest to change. And treat performance as part of a model's lifecycle, with the tools, permissions and checks that let a fast model stay fast as people change it.
Rosa added a fourth from the finance side. The fastest change of all had been asking the users what they needed: the unused SalesLineID column, the 48,000-row table nobody read and the four reports nobody opened had all been found by asking. Dana said she would take that one to the next finance leadership meeting.
Where this fits in the DP-600 outline
The work in this course covers the part of the DP-600 outline about optimizing enterprise-scale semantic models and the parts of managing a solution that deal with semantic models: improving DAX and model performance, using DAX Studio and Tabular Editor 2, configuring Direct Lake and incremental refresh, choosing storage modes and aggregations, creating reusable assets, running impact analysis, and deploying and managing semantic models through the XMLA endpoint and deployment pipelines. As noted at the start of the course, the study guide page and the certification page showed different outlines in November 2026, so learners should check both, and the guide's change log, before booking. The next course, MSAZ-319, prepares for the exam itself.
Questions from the review
Dana asked how much of the improvement would survive the F16, since every number had been measured on the trial capacity. Keiko answered with lesson 2's estimate: the store page's 1.9 seconds might become two to three seconds on the smaller capacity, which was still within the pass criterion, and the refresh, which ran overnight when nothing else did, should take a little longer but stay well under the five-hour limit. The rehearsal would replace these estimates with measurements.
Elena asked what would go wrong first. Keiko's answer was the one thing the team could not tune: growth in use. If the pilot went well, more head office staff would ask for access, and Grace had already said she wanted assistant store managers on the reports by spring. The capacity estimate scaled with readers, so doubling the readers would roughly double the interactive load, still far within the hour's capacity on average but with larger bursts. The plan was to watch the capacity metrics app weekly from the first day of the pilot and to agree, before anyone asked, what level of sustained use would trigger a request for a larger capacity.
Nikolai asked about the engineering side. Several of the fixes had moved work upstream into the warehouse and pipelines: the SaleTime column, the summary view for Finance History, the nightly OPTIMIZE and the pre-warm step. Each was now something the data engineers had to keep working. He asked for each to be listed in the pipeline's runbook with an owner and a test, so that a change to a pipeline could not silently undo a performance fix. Marisol agreed and added it to the plan for November. Rosa's question was the simplest: could she now change a measure herself? Yes, Marisol said, in the project, through a pull request, and with the checklist; the difference from October was that the path was written down and the tools would catch most mistakes before finance saw them.
Common mistakes
MistakePerformance work is mainly about faster DAX.
InsteadThe case touched model size, DAX, refresh, Direct Lake, report design and how models are shared; each layer needed its own fix.
MistakeAn hourly capacity average proves a capacity is big enough.
InsteadAverages hide bursts; a rehearsal with written pass criteria tests the peaks.
MistakeOnce a model is tuned, it stays tuned.
InsteadChanges, growth and new users undo tuning unless checks, permissions and pipelines protect it.
MistakeCertification is a badge for good models.
InsteadAt the hub it is evidence that the checklist from all the earlier work has been met.
Summary and key terms
- The case combined model size, DAX, aggregations, incremental refresh, XMLA tooling, Direct Lake tuning, report design, sharing, lineage and governance.
- The order of fixes mattered: shrink the model, then tune DAX, then refresh design, then lifecycle tools.
- Results included 1,820 to 831 MB, 11.4 to 1.9 seconds on the store page and a 2 h 40 min refresh down to 9 minutes.
- Capacity estimates use capacity unit seconds, but averages hide peaks; rehearsals need written pass criteria.
- Per-model memory and Direct Lake guardrails on the F16 were checked model by model.
- Keep performance in the lifecycle: measure, fix the right layer and protect the result.
- Capacity unit second
- The unit in which Fabric measures compute use on a capacity.
- Pass criteria
- Measurable conditions, written before a test, that decide whether it succeeded.
- Throttling
- Delays or rejections a capacity applies when use exceeds what it can provide.
- Rehearsal
- A test run of the expected load before going live.
- Peak hour
- The hour of the day with the highest expected use.
Practice problems
Work each problem on paper first, then reveal the answer to check.
What was the store page time before and after?
Show answer
11.4 seconds before and 1.9 seconds after, on the trial capacity.
Why did incremental refresh make external tools necessary?
Show answer
Republishing from Desktop would replace the partitions, so changes had to go through XMLA tools or pipelines.
How many capacity unit seconds does an F16 provide in an hour?
Show answer
16 × 3,600 = 57,600.
Why was the hourly estimate not enough on its own?
Show answer
Averages hide short bursts, and Fabric smooths interactive work over minutes.
What was Rosa's addition to Marisol's lessons?
Show answer
Asking the users what they need found several of the easiest savings.
Lesson quiz · 5 questions
Score 60% or more to complete this lesson.
Create a free account to save your progress, take quizzes and earn a certificate.