
MSAZ-311 · Lesson 9 of 12 · 20 min
DAX measures and calculation groups
▶ Video coming soon A video version of this lesson is on the way.
The ninth model session, on Tuesday, November 10, was the one Keiko had been dreading. She had written Excel formulas for years, and she had heard that DAX looks like Excel but does not behave like it. Marisol agreed. "The syntax is easy," she said. "The idea you need is context. Once you see context, the rest is vocabulary."
Measures and calculated columns
DAX, Data Analysis Expressions, is the formula language of semantic models. It is used in two main places. A calculated column is computed once per row when the model is refreshed and stored like any other column; it is evaluated in a row context, so it can refer to the other columns of the same row. A measure is not stored; it is evaluated at query time, once for every cell of a visual, in that cell's filter context. Totals, ratios, comparisons and anything that should respond to slicers belong in measures. Calculated columns are for attributes that filter or group, and lesson 7 showed that in Direct Lake models even those are best computed in the warehouse.
Filter context
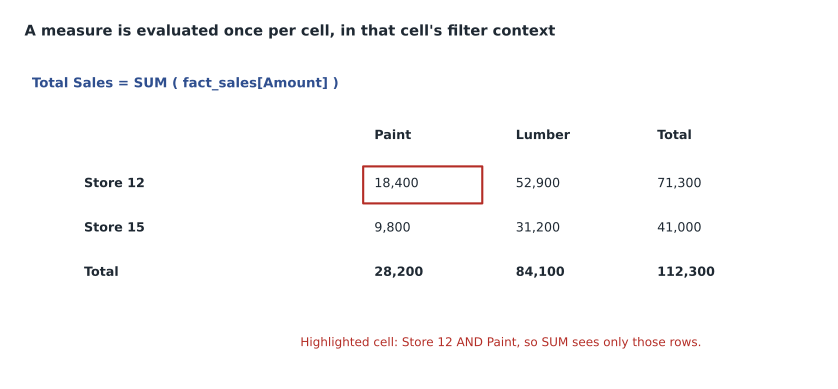
When a visual shows sales by store and category, each cell is a question with its own filters. The cell for Store 12 and Paint has two filters, one from each axis, plus any slicers and page filters. Relationships carry those filters to fact_sales, and the measure SUM ( fact_sales[SalesAmount] ) adds only the rows that survive. The total cell for Store 12 has only the store filter, so the same measure gives a different answer. Nothing in the measure changes; the context does.
Total Sales = SUM ( fact_sales[SalesAmount] )

Total Cost = SUM ( fact_sales[CostAmount] )

Gross Margin = [Total Sales] - [Total Cost]

Gross Margin Pct =
DIVIDE ( [Gross Margin], [Total Sales] )
Two habits appear in those four lines. Measures build on measures, so Gross Margin reuses Total Sales and Total Cost, and fixing a definition fixes everything built on it. And DIVIDE replaces the division operator, because it returns a blank instead of an error when the denominator is zero, which happens in any store and month with no sales.
CALCULATE: changing the context
CALCULATE is the most important function in DAX. It evaluates an expression in a modified filter context: it can add filters, replace filters on a column, or remove them. Paint Sales = CALCULATE ( [Total Sales], dim_product[Category] = "Paint" ) returns paint sales in every cell, whatever category the visual shows, because the filter argument replaces any category filter. Share of Store Sales divides the store's sales by the store's sales with the category filter removed, using REMOVEFILTERS.
Paint Sales =
CALCULATE ( [Total Sales], dim_product[Category] = "Paint" )

Share of Store Sales =
VAR ThisCell  = [Total Sales]
VAR AllCats   = CALCULATE ( [Total Sales], REMOVEFILTERS ( dim_product[Category] ) )
RETURN
    DIVIDE ( ThisCell, AllCats )

Delivered Sales =
CALCULATE ( [Total Sales], USERELATIONSHIP ( fact_sales[DeliveryDateKey], dim_date[DateKey] ) )
The VAR and RETURN keywords define variables. A variable is evaluated once, where it is defined, which makes measures easier to read, avoids repeating the same expression and often makes them faster. The last measure uses USERELATIONSHIP to switch from the active sale-date relationship to the inactive delivery-date one from lesson 8, only inside this calculation.
Iterators
Aggregations such as SUM work on one column. When a calculation must be done row by row first, an iterator does it: SUMX, AVERAGEX, MAXX and others take a table and an expression, evaluate the expression for each row, then aggregate. Keiko's margin per unit needed price minus unit cost for each line, times quantity. If the fact table had held only quantity and unit cost, Total Cost would have been SUMX ( fact_sales, fact_sales[Quantity] * fact_sales[UnitCost] ); because the warehouse already stored CostAmount per line, a plain SUM was enough and cheaper. Marisol's point: compute what you can once, in the warehouse, and iterate only when the calculation must happen in context.
Time intelligence
Comparisons over time are most of what Grace asks for. With dim_date marked as the date table, DAX's time intelligence functions shift the date filter: SAMEPERIODLASTYEAR moves it back one year, DATESYTD builds the year to date, and both accept a fiscal year end. Harrow & Finch's fiscal year starts on February 1, so year-to-date measures pass the year end date as January 31.
Sales PY =
CALCULATE ( [Total Sales], SAMEPERIODLASTYEAR ( dim_date[Date] ) )

Sales YoY Pct =
DIVIDE ( [Total Sales] - [Sales PY], [Sales PY] )

Sales FYTD =
CALCULATE ( [Total Sales], DATESYTD ( dim_date[Date], "1-31" ) )
Newer DAX functions cover windows and positions. OFFSET returns a row a given number of steps away in an ordered set, such as the previous month; WINDOW returns a range of rows, such as the last three months for a rolling average; INDEX returns the row at a position, such as the first or last. Information functions tell a measure about its context: ISINSCOPE says whether a level of a hierarchy is in the current cell, HASONEVALUE says whether a column is filtered to one value, and SELECTEDVALUE returns that value or a default. Keiko used ISINSCOPE to make the margin rate show a store-level target only at store level and blank above it.
Calculation groups
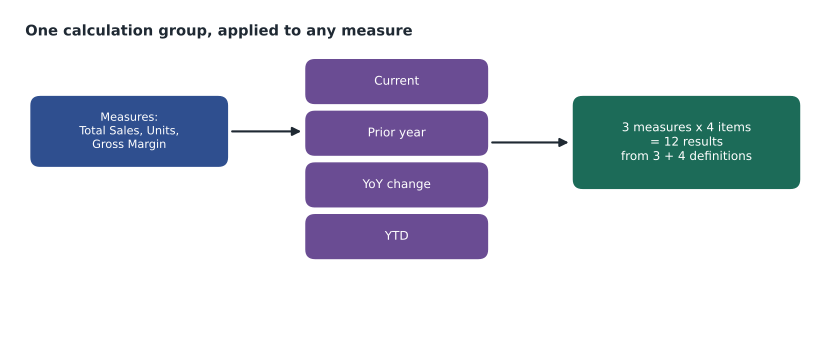
By the end of the hour Keiko had Total Sales, Units, Gross Margin and Gross Margin Pct, and Grace wanted each of them as current, prior year, year-over-year change and fiscal year to date. Written as measures, that is sixteen definitions, and a new base measure would need four more. A calculation group solves this. It is a special table whose rows, called calculation items, are DAX expressions that wrap whatever measure is in the visual, referred to as SELECTEDMEASURE().
Calculation group: Time Comparison   (column: Comparison)
  Current       = SELECTEDMEASURE ()
  Prior year    = CALCULATE ( SELECTEDMEASURE (), SAMEPERIODLASTYEAR ( dim_date[Date] ) )
  YoY change    = VAR Cur = SELECTEDMEASURE ()
                  VAR Prv = CALCULATE ( SELECTEDMEASURE (), SAMEPERIODLASTYEAR ( dim_date[Date] ) )
                  RETURN DIVIDE ( Cur - Prv, Prv )
  Fiscal YTD    = CALCULATE ( SELECTEDMEASURE (), DATESYTD ( dim_date[Date], "1-31" ) )
A report author puts the Comparison column on the columns of a matrix and any measure on the values, and gets all four views. Each calculation item can also have a format string expression, so YoY change shows as a rate per 100 even when the base measure is a currency amount. If a model has more than one calculation group, their precedence decides the order in which they apply. Calculation groups can be created in Power BI Desktop's model view, in the TMDL view or with Tabular Editor.
# What a calculation group does: apply each item's logic to each measure
sales = {2025: {"Total Sales": 1_840_000, "Units": 96_500},
         2026: {"Total Sales": 1_982_000, "Units": 99_800}}

items = {
    "Current":    lambda m: sales[2026][m],
    "Prior year": lambda m: sales[2025][m],
    "YoY change": lambda m: round((sales[2026][m] - sales[2025][m]) / sales[2025][m] * 100, 1),
}

for measure in ["Total Sales", "Units"]:
    print(measure, {name: f(measure) for name, f in items.items()})
print(len(items), "items x 2 measures =", len(items) * 2, "results from", len(items) + 2, "definitions")Total Sales {'Current': 1982000, 'Prior year': 1840000, 'YoY change': 7.7}
Units {'Current': 99800, 'Prior year': 96500, 'YoY change': 3.4}
3 items x 2 measures = 6 results from 5 definitionsWhat this code does
The example stores a year of paint sales and units for 2025 and 2026, and defines three calculation items as small rules: the current year's value, the prior year's value and the year-over-year change per 100 of the prior year. It applies every item to each measure, which is what a calculation group does in a matrix. The output shows sales up 7.7 per 100 and units up 3.4, and notes that six results came from five definitions, a gap that widens with every measure added.
Dynamic format strings and field parameters
Two related features appear in the DP-600 outline. A dynamic format string lets a measure choose its format with a DAX expression, for example showing sales as 1.9M or 412K depending on size, or using the currency symbol of the selected country; unlike the older trick of returning formatted text, the value stays a number and still sorts and charts correctly. A field parameter is a small table created in Power BI Desktop that lets report users choose which measure or column a visual shows from a slicer, so one chart can switch between sales, units and margin.
Worked problem
Reading a cell of the matrix
A matrix shows Store 12 and Store 15 against Paint and Lumber, using the numbers in this lesson's figure. What do Total Sales, Paint Sales and Share of Store Sales return in the cell for Store 15 and Lumber?
Show solution
- Filter context: Store 15 and Lumber. Total Sales sums Store 15's lumber rows: 31,200.
- Paint Sales replaces the category filter with Paint, keeping Store 15: 9,800, whatever column the cell is in.
- Share of Store Sales divides this cell by Store 15's sales with the category filter removed: 31,200 ÷ 41,000.
- 31,200 ÷ 41,000 is about 0.761.
Answer: 31,200; 9,800; and about 0.761, which a suitable format string shows as roughly 76 parts in 100.
Writing measures that others can trust
Marisol finished with practice rather than syntax. Each measure gets a description saying what it means in business terms. Measures live in display folders, and base measures that only exist to be reused can be hidden. Any measure that other teams will rely on is tested in the DAX query view against a known answer, such as StockLine's own month-end totals, before it is published. And complex logic is written with variables and line breaks, so that the next person can read it, because the next person is often the same analyst six months later.
Why context transition matters
One more idea completes the picture. When CALCULATE is used inside a row context, for example inside an iterator or a calculated column, it turns the current row into a filter context. This is called context transition, and it is why a measure referenced inside SUMX over dim_store returns each store's own value: every measure reference is implicitly wrapped in CALCULATE, so the row being iterated becomes a filter on dim_store. It explains the result of expressions such as AVERAGEX ( VALUES ( dim_store[StoreName] ), [Total Sales] ), the average store's sales, which differs from the total divided by the number of stores whenever some stores have no sales in the selected period. Keiko did not need to master context transition for the pilot, but Marisol wanted her to recognize it, because exam questions about iterators often hinge on it.
Distinct counts are the other common surprise. DISTINCTCOUNT ( fact_sales[CustomerKey] ) counts the customers who bought in each cell, and its total is not the sum of the rows, because a customer who bought in two stores is counted once at the total. That is correct, but report readers often expect totals to add up, so Marisol asked Keiko to describe the measure as "customers who bought in the selection" and to avoid placing it in tables where readers would add the rows themselves.
Common mistakes
MistakeA measure returns the same value wherever it is used.
InsteadA measure is evaluated in each cell's filter context, so its value depends on where it is used.
MistakeUse the division operator for ratios.
InsteadUse DIVIDE, which returns a blank instead of an error when the denominator is zero.
MistakeWrite a separate measure for every time comparison of every base measure.
InsteadA calculation group applies the comparison to any measure with SELECTEDMEASURE.
MistakeReturn formatted text to control number formats.
InsteadUse format strings or dynamic format strings so values stay numeric.
Summary and key terms
- Measures are evaluated at query time in each cell's filter context; calculated columns are stored per row.
- CALCULATE changes the filter context: adding, replacing or removing filters, or activating relationships.
- Variables make measures clearer and avoid repeated work; DIVIDE handles zero denominators.
- Iterators such as SUMX evaluate an expression per row and aggregate the results.
- Time intelligence needs a marked date table; fiscal years pass a year end date to functions such as DATESYTD.
- Calculation groups apply logic to any measure; dynamic format strings and field parameters make reports flexible.
- DAX
- Data Analysis Expressions, the formula language of semantic models.
- Measure
- A DAX calculation evaluated at query time in the current filter context.
- Calculated column
- A DAX column computed per row at refresh and stored in the model.
- Filter context
- The set of filters that applies when a measure is evaluated in a cell.
- CALCULATE
- A DAX function that evaluates an expression in a modified filter context.
- Iterator
- A DAX function, such as SUMX, that evaluates an expression for each row of a table.
- Calculation group
- A table of calculation items that modify whichever measure is in context.
- Field parameter
- A table that lets report users choose which measure or column a visual shows.
Practice problems
Work each problem on paper first, then reveal the answer to check.
Why does the same measure show different values in different cells?
Show answer
Each cell has its own filter context.
What does REMOVEFILTERS do inside CALCULATE?
Show answer
It removes filters from the given column or table for that calculation.
Which year end does Harrow & Finch pass to DATESYTD?
Show answer
January 31, written "1-31", because the fiscal year starts on February 1.
What does SELECTEDMEASURE refer to in a calculation item?
Show answer
Whichever measure is in the visual when the item applies.
Why use a dynamic format string instead of FORMAT?
Show answer
The value stays numeric, so it still sorts and charts correctly.
Lesson quiz · 5 questions
Score 60% or more to complete this lesson.
Create a free account to save your progress, take quizzes and earn a certificate.