
MSAZ-311 · Lesson 12 of 12 · 20 min
A modelling case study
▶ Video coming soon A video version of this lesson is on the way.
The last model session, on the afternoon of Thursday, November 12, was a review. Marisol asked Keiko to walk Elena, Nikolai and Grace through the store margin solution from the source files to the report, as if they were seeing it for the first time, and to explain each decision in one or two sentences. "If you can't explain why it is built that way," Marisol said, "you will not be able to fix it at two in the morning." This lesson follows that walkthrough, and it doubles as a review of the course.
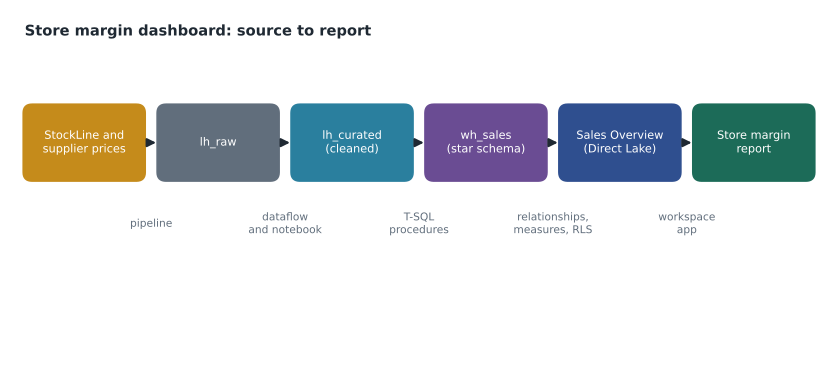
1. The question and the data
Keiko began where lesson 1 began: Grace's question, which stores lost paint margin last quarter and whether it was price, mix or shrink. The data it needed was sales lines, supplier costs, products, stores and inventory adjustments, and each came from a different place with a different rhythm. Writing that table first, before any tool was chosen, was the decision Elena said she most wanted every project to copy.
2. Getting data in
Sales lines and inventory adjustments come from StockLine through Ines's nightly pipeline, with incremental copies on a modified-date watermark, landing in lh_raw exactly as received. Because a watermark misses deletions, a weekly job compares row counts by day between StockLine and lh_raw for the last 35 days and reloads any day that differs. Supplier price files arrive monthly in a shared folder and go through Keiko's dataflow, which cleans them with Power Query and replaces the supplier_price table in lh_curated; one sample file per supplier is kept in a test folder for checking rule changes. Nothing is shortcut or mirrored for this solution, because every source either sits on the company network or needs cleaning first.
3. Cleaning and shaping
The sales lines are cleaned in a notebook: test transactions removed, quantities cast to whole numbers, non-members mapped to customer 0, rows with missing amounts quarantined, and resent transactions removed by keeping the latest load of each transaction line. The notebook writes lh_curated.sales_lines, partitioned by sale year, and checks its row counts and totals before and after. Products and stores are cleaned with SQL views in wh_sales, which read lh_curated by three-part names, and stored procedures load the dimensions: Type 1 for corrected product names, Type 2 for store regions, which preserved the October 31 region change for Store 15 and three others.
| Step | Tool | Why that tool |
|---|---|---|
| Copy StockLine tables | Pipeline copy activity, incremental | Large, plain copies on a schedule |
| Clean supplier price files | Dataflow Gen2 | Many small, inconsistent files; analyst-owned rules |
| Deduplicate and clean sales lines | Notebook (PySpark) | Large table, window-function logic, reusable code |
| Clean products and stores, Type 2 history | T-SQL views and stored procedures in wh_sales | Set-based SQL, transactions for history changes |
| Load the star schema | Stored procedures run by the pipeline | One place for logic, versioned in Git |
4. The star schema
wh_sales holds three fact tables with declared grains: fact_sales, one row per sales line; fact_sales_target, one row per store per month; and fact_inventory_adjustment, one row per adjustment. They share conformed dimensions for date, store and product, so sales, targets and shrink can sit side by side in one report. The date dimension carries the retail fiscal calendar that starts on February 1. Unknown SKUs map to an unknown product row with key -1, so their sales stay in the totals and appear in the data quality report. Keys are whole-number surrogate keys, except the readable date key, and constraints are declared NOT ENFORCED, with the load procedures doing the checking.
5. The semantic model
Sales Overview is a Direct Lake model on the wh_sales tables. A refresh step at the end of the nightly pipeline reframes it only after every table has loaded and passed its checks, around 6:10 a.m., so store managers never see a fact table loaded before its dimensions. Automatic updates are off by design. The model's tables are well within the F16 guardrails after the adjustments table was optimized, and the Direct Lake behaviour is set to Direct Lake only, so any query that would fall back raises an error instead of running slowly. The regional managers list, once a spreadsheet, now loads into wh_sales so the whole model stays in one mode.
Relationships are one-to-many from dimensions to facts, single direction, with one exception: the security table's relationship to dim_store, which applies security filters in both directions. The delivery-date relationship is inactive and used by two measures through USERELATIONSHIP. Keys are hidden, months sort by month number, the store's city has a data category, numeric labels summarize by none, measures sit in display folders with descriptions, and dim_date is marked as the date table.
Total Sales      = SUM ( fact_sales[SalesAmount] )
Total Cost       = SUM ( fact_sales[CostAmount] )
Gross Margin     = [Total Sales] - [Total Cost]
Gross Margin Pct = DIVIDE ( [Gross Margin], [Total Sales] )
Margin Pct (Store) = DIVIDE ( SUM ( fact_sales[MarginAmount] ), [Total Sales] )   -- no dependency on hidden cost objects
Shrink Cost      = CALCULATE ( SUM ( fact_inventory_adjustment[CostChange] ),
                               fact_inventory_adjustment[ReasonKey] IN { 3, 4 } )

Calculation group Time Comparison: Current, Prior year, YoY change, Fiscal YTD
6. Security
Three roles protect the model. StoreManagers filters security_store with USERPRINCIPALNAME(), so each manager, relief manager and regional director sees only their stores, and object-level security hides cost columns and the measures that depend on them. HeadOffice sees everything. Merchandising sees all stores but not supplier costs. Role membership is assigned to groups, the security table is loaded nightly from HR with checks that fail safe, and a monthly reconciliation compares it with HR and with Purview audit records of who opened the report. Because the model uses its own roles, it reads OneLake through a fixed identity connection. Store managers reach the report through the FDH Sales app, never as workspace members, because Admins, Members and Contributors bypass RLS.
7. Proving the numbers
Elena's first question was the one Keiko had been expecting: how do we know the numbers are right? Keiko showed the reconciliation that runs after each nightly load and before the model is reframed. It compares the day's sales total in fact_sales with StockLine's own end-of-day total for each store, and the load stops if any store differs by more than a cent.
# Nightly reconciliation: model totals against StockLine's end-of-day totals (cents)
stockline_totals = {12: 1_823_455, 15: 1_104_220, 16: 987_310, 21: 1_456_090}
fact_totals      = {12: 1_823_455, 15: 1_104_220, 16: 988_140, 21: 1_456_090}

problems = []
for store, expected in stockline_totals.items():
    actual = fact_totals.get(store, 0)
    if abs(actual - expected) > 1:          # allow one cent for rounding
        problems.append((store, expected, actual, actual - expected))

if problems:
    for store, exp, act, diff in problems:
        print(f"Store {store}: StockLine {exp / 100:,.2f}, fact {act / 100:,.2f}, difference {diff / 100:,.2f}")
    print("Load stopped: model not reframed")
else:
print("All stores reconcile: reframe the model")Store 16: StockLine 9,873.10, fact 9,881.40, difference 8.30 Load stopped: model not reframed
What this code does
The example holds each store's end-of-day sales total from StockLine and the same total from the hub's fact table, both in cents so that no rounding creeps in. It compares them store by store and collects any store that differs by more than one cent. The output reports that Store 16's fact total is 8.30 dollars higher than StockLine's and that the load has stopped, so the model keeps showing the previous day's correct numbers until the difference is explained.
The example used real numbers from a test night on November 10, when Store 16's difference turned out to be a sale that the till had resent after midnight with a new load timestamp but an old transaction date. The deduplication rule had kept both copies because they fell into different nightly batches. Keiko changed the notebook so that each night's deduplication looks back over the previous seven days of loads, not just the current batch, and the reconciliation passed the next night.
8. Answering the question
The answer to Grace's question came from lesson 11: four stores lost more than three points of paint margin year over year; two through supplier cost increases not passed on, one through mix towards contractor sales, and one, Store 15, through shrink after a roof leak. Grace said the most useful part was not the four findings but the fact that next quarter she could open the report and see the same breakdown herself, filtered to any region, without asking anyone.
9. Working as a team
Every item in the solution is in Git: the dataflow, the notebook, the warehouse's views and procedures, the semantic model in TMDL and the report. Changes start in a feature branch, go through a pull request that someone else reviews, merge to main, and update the FDH Sales Dev workspace. The deployment pipeline then promotes them to Test and, for the pilot, to Prod, with deployment rules pointing the notebook and model at each stage's lakehouse and warehouse, as MSAZ-310 described. Nothing reaches store managers without passing Test, including the security tests from lesson 10, which Keiko recorded as a checklist in the repository.
10. What happens next
The pilot is planned to start on an F16 capacity on Monday, January 4, 2027, for 140 report readers: 69 store managers and 71 head office staff. Before then, the team plans to run the full nightly load for two weeks on the trial capacity, which ends on December 18, 2026, and to watch the Capacity Metrics app for the morning peak. Keiko plans to sit DP-900 in March 2027 and DP-600 in the autumn; MSAZ-312 will take her into enterprise model performance, incremental refresh, aggregations and external tools, and MSAZ-319 will review the whole DP-600 outline.
Worked problem
Sizing the morning peak
In the trial, the store margin report's home page used about 6 capacity unit-seconds per view, and other pages about 3. In the pilot, assume all 69 store managers open the home page and four other pages between 7:30 and 8:00 a.m., and 40 head office readers do the same. An F16 provides 16 CU-seconds every second. What share of the F16's capacity for that half hour would the views use, if spread evenly?
Show solution
- Each reader uses 6 + 4 × 3 = 18 CU-seconds.
- Readers: 69 + 40 = 109, so the peak uses 109 × 18 = 1,962 CU-seconds.
- An F16 provides 16 × 1,800 = 28,800 CU-seconds in half an hour.
- 1,962 ÷ 28,800 is about 0.068, roughly 7 parts in 100 of the capacity.
Answer: About 7 in 100 of the F16 for the half hour, leaving plenty of room, provided heavy background work such as backfills stays out of the morning window.
The estimate was deliberately rough, and Marisol pointed out its weakest assumption: views are never spread evenly, and if everyone opens the report at 7:59, interactive smoothing over a few minutes, rather than half an hour, is what decides whether anyone waits. That is why the team planned to measure the real peak in the two-week rehearsal rather than trust a calculation.
Elena's sign-off
Elena approved the solution for the pilot with three conditions: the reconciliation and security checks stay mandatory, the reframe step never runs if either fails, and the BI team documents in the model's description who owns it and how to request changes. Grace asked when the same could be done for lumber and for the Rewards program. Marisol said the model already held everything needed for lumber, and that Rewards would wait for the household bridge to be reviewed. Keiko, who three weeks earlier had owned a spreadsheet, now owned a model that 140 people would rely on.
Common mistakes
MistakeExplain a solution by its tools.
InsteadExplain it by its decisions: what each step does and why that tool was chosen.
MistakeReframe the model on a timer.
InsteadReframe only after loads and checks succeed, so reports never show half-loaded or wrong data.
MistakeA capacity estimate spread over half an hour is reliable.
InsteadReal peaks cluster; measure them in a rehearsal before trusting a calculation.
MistakeSecurity can be tested once at launch.
InsteadKeep security tests in the checklist for every deployment and reconcile the security table monthly.
Summary and key terms
- Start from the business question and the data it needs, then choose a route and tool for each source.
- Use pipelines for plain copies, dataflows for analyst-owned shaping, notebooks for complex code and SQL procedures for set-based loads.
- Model a star with declared grains, conformed dimensions, surrogate keys and an unknown member.
- Build a Direct Lake model reframed after checks, with single-direction relationships, clear properties, base measures and a calculation group.
- Protect it with dynamic RLS, OLS and a fixed identity, and test with View as.
- Reconcile numbers nightly, keep every item in Git, and promote through Test before Prod.
- Reconciliation
- Comparing totals between the source and the target to prove a load is complete and correct.
- Reframe
- Pointing a Direct Lake model at the latest table versions after a load.
- Conformed dimension
- A dimension shared with the same keys and meaning by several fact tables.
- Rehearsal
- Running the real workload before go-live to measure performance and capacity.
Practice problems
Work each problem on paper first, then reveal the answer to check.
Why does the weekly job compare row counts by day between StockLine and lh_raw?
Show answer
Because the incremental watermark cannot see deletions or silent changes.
What stops the model being reframed?
Show answer
A failed reconciliation or security check in the nightly pipeline.
Why does Margin Pct (Store) exist?
Show answer
So store managers get a margin measure that does not depend on cost objects hidden by OLS.
How did Keiko fix the Store 16 difference?
Show answer
By deduplicating over the previous seven days of loads, not only the current batch.
Why measure the morning peak in a rehearsal?
Show answer
Real views cluster in minutes, so an even spread underestimates the peak.
Lesson quiz · 5 questions
Score 60% or more to complete this lesson.
Create a free account to save your progress, take quizzes and earn a certificate.