
MBA-613 · Lesson 7 of 12 · 23 min
Designing the change: structure, process and systems
Owen Tremblay's merger team at Prairie Ridge Energy has spent three months on the new organization chart. It shows a single vice-president of operations, four regional directors who each oversee both gas and renewables sites, and a central safety and maintenance group. The chart is elegant. Dr. Morin asks what else changes on the day it takes effect. The team's list is short: new email groups, new reporting lines and a town hall. Dr. Morin asks about the safety management system, the maintenance planning software, the on-call rotations, the operators' certifications, the bonus plan, the incident reporting forms and the weekly production meeting. Each of these is still different in the two divisions, and each will either reinforce the new structure or quietly preserve the old one.
Lesson 3 showed that organizations are systems whose parts fit together. This lesson turns that insight into design. A change designed only at the level of structure, or only at the level of communication, leaves the other parts of the system pulling behaviour back to where it was. The design of a change specifies what will be different in each part of the system, how the parts will be kept consistent, and in what order the changes will be made.
The 7-S framework
In 1980 Robert Waterman, Tom Peters and Julien Phillips, then consultants at McKinsey, published an article titled 'Structure Is Not Organization'. Its argument was that executives who try to change an organization by redrawing the chart are usually disappointed, because structure is only one of seven interdependent elements. Three are 'hard': strategy, the plan for building advantage; structure, the division and coordination of work; and systems, the formal and informal procedures, from budgeting to performance reviews, that make the organization run day to day. Four are 'soft': shared values, originally called superordinate goals, the guiding ideas at the centre of the organization; style, the way leaders actually behave and spend their time; staff, the people and how they are developed; and skills, the distinctive capabilities of the organization as a whole.
The framework's value is as a checklist and as a reminder that the soft elements are often the hardest to change. A change design should state, for each S, what the current state is, what the target state is and what will be done to move it. Where one S changes and the others do not, the design should expect friction.
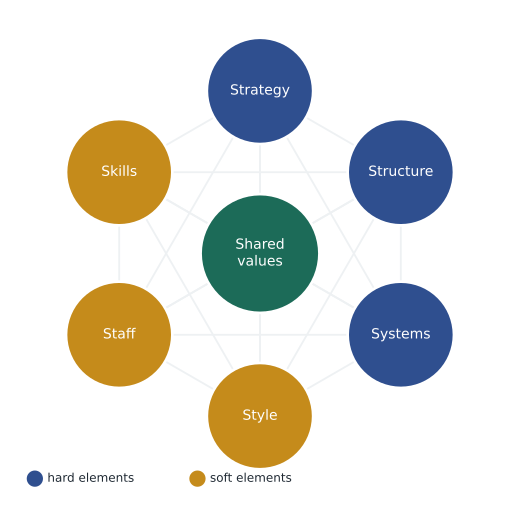
Owen's team applies the framework to the merger. Strategy: one operations organization that shares maintenance, spares and expertise across gas and renewables sites. Structure: regional directors over mixed sites, a central safety and maintenance group. Systems: two safety management systems, two maintenance planning tools, two incident reporting processes, two bonus plans. Shared values: both divisions value safety, but gas staff define it as strict procedure and renewables staff as empowered crews who stop work when unsure. Style: gas managers are directive and present on site; renewables managers coordinate remotely. Staff: gas operators are older, long-serving and hold certifications that do not cover wind turbines. Skills: deep process safety in gas; fast troubleshooting of distributed assets in renewables. The new structure changes one S. The other six will decide whether it works.
Aligning measures and rewards
No part of the system is more powerful than what is measured and rewarded. Steven Kerr's 1975 article 'On the Folly of Rewarding A, While Hoping for B' collected examples of organizations that wanted one behaviour and paid for another: universities that wanted good teaching and promoted on research, companies that wanted teamwork and paid individual bonuses, governments that wanted long-term planning and rewarded short-term results. Its lesson is that people respond to the incentives they see, not to the ones leaders intend.
For change design, this means auditing the measures and rewards that touch the people who must change. Cedarline's planners have been measured on in-stock rates and paid bonuses when stores did not run out. The new strategy asks them to carry fewer styles and less inventory. Unless their measures change to balance in-stock rates against inventory turns and markdowns, they will protect themselves by ordering more, whatever the strategy says. The people strategy in MBA-601 already proposed balanced goals for planners; the change design must make sure that the new goals arrive before the new process, not a year later.
Processes and the path of least resistance
Chip and Dan Heath's advice to 'shape the path' draws on research in behavioural economics. Richard Thaler and Cass Sunstein's 2008 book Nudge described how choice architecture, the way options are presented, changes behaviour without changing incentives. Defaults are especially powerful: people tend to accept whatever happens if they do nothing. Studies of retirement savings plans found that making enrolment automatic, with the option to opt out, sharply increased participation compared with requiring people to opt in.
In change, shaping the path means making the new behaviour the easiest one. If store associates are to offer repair options with every sale, the point-of-sale screen should prompt them, the repair price list should be beside the till and the booking should take less than a minute. If planners are to use the new sales and operations planning forecast, the old spreadsheets should be retired, not left available as an alternative. If physicians are to use the documentation system, the system should open automatically when the consultation begins. Every extra step on the new path, and every shortcut left open on the old one, is a restraining force.
Sequencing and the order of change
Changes depend on each other. Some must come first because others need them: the people strategy's reduction of supervisor spans in Cedarline's distribution centre must precede the new warehouse management system, because supervisors with twenty-two people each have no time to train pickers on new scanners. Some must happen together because they reinforce each other: the end of storewide promotions and the new associate scorecard, so that associates are not paid on the volume that promotions used to produce. Some can be delayed without harm, and delaying them reduces the load on the same people.
Dr. Morin suggests drawing a dependency map: each change as a box, with arrows showing which changes need which. The map exposes the critical path and also the places where the plan asks the same group to absorb several changes at once. It is often the second problem, not the first, that sinks a transformation.
Change load and saturation
Every change requires attention, learning and effort from the people it affects, in addition to their normal work. Organizations have a limited capacity to absorb change, and the capacity differs between groups. When too many changes land on the same people at the same time, the result is change saturation: people cannot learn everything at once, so they comply minimally with all of it, revert to old habits under pressure and grow cynical about the next initiative. Practitioner surveys, including Gartner's 2025 research, report widespread change fatigue, and many leaders underestimate it because each change looks manageable from the perspective of the team that designed it.
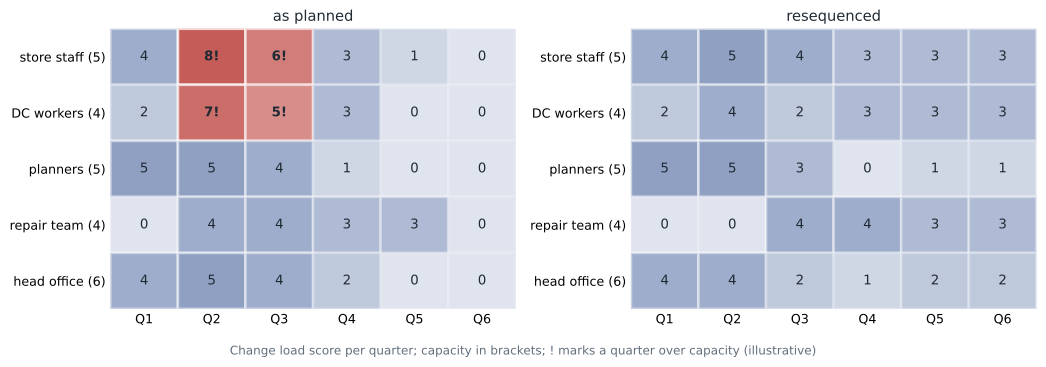
A change load heat map makes the problem visible. For each group affected, the team estimates the impact of each change in each period, for example on a scale from zero to three, and compares the total with the group's capacity, which depends on its workload, staffing and experience of change. Cedarline's transformation office has prepared a first estimate for the next six quarters.
# Change load heat map: impact of each change on each group per quarter (0 none to 3 heavy)
groups = ["store staff", "DC workers", "planners", "repair team", "head office"]
capacity = {"store staff": 5, "DC workers": 4, "planners": 5, "repair team": 4, "head office": 6}
quarters = ["Q1", "Q2", "Q3", "Q4", "Q5", "Q6"]

# change: (start quarter index, duration in quarters, impact by group)
changes = {
    "range reduction":         (0, 2, {"store staff": 1, "planners": 2, "head office": 1}),
    "end of promotions":       (0, 2, {"store staff": 2, "head office": 1}),
    "new store scorecard":     (0, 2, {"store staff": 1}),
    "S and OP planning":       (0, 3, {"planners": 3, "head office": 2}),
    "weekly replenishment":    (1, 2, {"store staff": 1, "DC workers": 2}),
    "DC supervisor spans":     (0, 2, {"DC workers": 2}),
    "new warehouse system":    (1, 3, {"DC workers": 3, "head office": 1}),
    "durability training":     (1, 2, {"store staff": 2, "repair team": 1}),
    "repair service growth":   (1, 4, {"repair team": 3, "store staff": 1}),
    "single inventory view":   (2, 2, {"store staff": 2, "planners": 1, "head office": 1}),
}

def load(plan):
    grid = {g: [0] * len(quarters) for g in groups}
    for name, (start, dur, impact) in plan.items():
        for q in range(start, min(start + dur, len(quarters))):
            for g, v in impact.items():
                grid[g][q] += v
    return grid

def show(grid, title):
    print(title)
    print(f"{'':12s}" + "".join(f"{q:>5s}" for q in quarters))
    for g in groups:
        cells = "".join(f"{v:4d}{'!' if v > capacity[g] else ' '}" for v in grid[g])
        print(f"{g:12s}{cells}  capacity {capacity[g]}")

show(load(changes), "as planned (! = over capacity)")
# Resequence: the warehouse system waits until spans and weekly replenishment are settled;
# durability training and repair growth start in Q3; the inventory view moves to Q5
revised = dict(changes)
revised["new warehouse system"] = (3, 3, {"DC workers": 3, "head office": 1})
revised["durability training"] = (2, 2, {"store staff": 2, "repair team": 1})
revised["repair service growth"] = (2, 4, {"repair team": 3, "store staff": 1})
revised["single inventory view"] = (4, 2, {"store staff": 2, "planners": 1, "head office": 1})
show(load(revised), "resequenced")as planned (! = over capacity)
Q1 Q2 Q3 Q4 Q5 Q6
store staff 4 8! 6! 3 1 0 capacity 5
DC workers 2 7! 5! 3 0 0 capacity 4
planners 5 5 4 1 0 0 capacity 5
repair team 0 4 4 3 3 0 capacity 4
head office 4 5 4 2 0 0 capacity 6
resequenced
Q1 Q2 Q3 Q4 Q5 Q6
store staff 4 5 4 3 3 3 capacity 5
DC workers 2 4 2 3 3 3 capacity 4
planners 5 5 3 0 1 1 capacity 5
repair team 0 0 4 4 3 3 capacity 4
head office 4 4 2 1 2 2 capacity 6The first heat map shows the problem the chief executive feared. Store staff are well over capacity in the second and third quarters, when the end of promotions, the scorecard, weekly replenishment, durability training, the repair service and then the inventory view all arrive together. Distribution centre workers are over capacity in the second and third quarters too, because the warehouse system arrives while supervisor spans are still being reduced and weekly replenishment begins. The resequenced plan starts the warehouse system in the fourth quarter, after the supervisors are in place and weekly replenishment has settled, starts durability training and the larger repair service in the third quarter and delays the single inventory view to the fifth. Every group is now at or below capacity in every quarter. The total amount of change has not fallen; it has been spread so that each group can absorb it. The cost is that some benefits arrive later, which lesson 12 will value.
Pilots, phases and big bangs
A design must also decide how to roll out each change. A big bang launch changes everything for everyone at once. It avoids running two systems in parallel and creates a clear break with the past, but it concentrates risk: if something goes wrong, it goes wrong everywhere. A phased rollout changes one site, region or group at a time. It allows learning between phases and spreads the load on support teams, but it lasts longer and creates a period in which parts of the organization work differently. A pilot tests a change in one place before deciding whether and how to roll it out. It is the purest form of learning, but pilots chosen for their enthusiasm can produce results that do not travel, and pilots that are never scaled teach people that changes are experiments to be waited out.
Dr. Morin's rules of thumb are these. Use a pilot when the change is novel and its effects uncertain, and choose a pilot site that is representative rather than the most enthusiastic. Use a phased rollout when the change is understood but demands heavy support, or when groups differ enough that later phases benefit from earlier lessons. Use a big bang when running two systems would be costly or dangerous, as with a financial ledger or a safety system, and invest heavily in preparation and rehearsal. For Prairie Ridge's single safety management system, a big bang is probably necessary, because two safety systems in one organization create confusion about which rules apply; but the big bang should be preceded by joint drills at mixed sites and a period in which both divisions' operators help write the merged procedures.
Designing for reversibility and learning
Transformations are made of many decisions, some easily reversed and some not. Jeff Bezos of Amazon popularized a distinction between one-way doors, decisions that are hard to undo and deserve careful deliberation, and two-way doors, decisions that can be reversed and should be made quickly. A change design benefits from identifying which elements are which. Cedarline's decision not to open eighteen new stores is easily revisited; its range reduction is partly reversible, though customers lost may not return; its collective agreement commitments are binding for their term. The design should place learning and experiment in the reversible parts and care and consultation in the irreversible ones.
| Element (7-S) | Current state at Cedarline | Target state | Design action |
|---|---|---|---|
| Strategy | Growth by adding styles, stores and channels | Focus on durability and repair | Board approved; translate into unit goals |
| Structure | Merchandising, planning and supply chain separate | Chief operating officer over all three | In place; clarify decision rights |
| Systems | Planner bonuses on in-stock rates; sales bonuses for associates | Balanced planner goals; store scorecard | Change before new processes start |
| Shared values | Pride in launches and big seasons | Pride in products that last | Stories, recognition, repair visible in stores |
| Style | Executives focus on weekly sales | Executives review returns, repairs and inventory | Change the agenda of the weekly meeting |
| Staff | Few planners; thin repair team | Eight planners; larger repair team | Hiring and development program |
| Skills | Selling new product | Advising on durability and repair | Durability training; repair technicians in stores |
Worked problem
Designing the Prairie Ridge safety integration
Prairie Ridge must move from two safety management systems to one within a year. Gas operators trust their procedure-heavy system; renewables crews trust their stop-work authority. Propose a design covering systems, skills, style and rollout.
Show solution
- Systems: a joint team of gas and renewables operators drafts the merged system, keeping gas process safety procedures for gas sites and adopting stop-work authority for all crews; one incident reporting form and one database.
- Skills: cross-training so that gas operators learn turbine hazards and renewables technicians learn process safety; certifications mapped and gaps scheduled.
- Style: regional directors spend the first three months visiting sites of the division they did not come from and attend joint safety meetings.
- Shared values: frame the merged system around a value both share, that everyone goes home safe, with examples from each division's record.
- Rollout: joint drills and parallel incident reporting for three months, then a single switch date for the new system, because two systems in one organization cannot coexist safely for long; rehearse the switch at two mixed sites first.
Answer: The design changes systems, skills, style and values together, gives both divisions a hand in writing the result, and uses a rehearsed big bang only for the element where two parallel systems would be dangerous.
Common mistakes
MistakeRedrawing the chart changes the organization.
InsteadStructure is one of seven elements; unchanged systems, style and values pull behaviour back.
MistakeTell people what to do and leave the old way available.
InsteadMake the new path the easiest one, through defaults, prompts and retiring old tools.
MistakeEach change is manageable, so the whole is.
InsteadChanges land on the same people; a load heat map shows when the total exceeds capacity.
MistakePilot in the most enthusiastic site.
InsteadChoose a representative pilot so the results travel, and decide in advance how a pilot will be scaled.
Summary and key terms
- Change design specifies what changes in each part of the system, how the parts stay consistent and in what order.
- The 7-S framework distinguishes hard elements (strategy, structure, systems) from soft ones (shared values, style, staff, skills).
- Measures and rewards must change with, or before, the behaviour they are meant to support.
- Shaping the path through defaults and simpler processes makes new behaviour easier than old.
- Sequencing, change load analysis and the choice between pilots, phases and big bangs determine whether people can absorb the change.
- 7-S framework
- Seven interdependent elements of an organization: strategy, structure, systems, shared values, style, staff and skills.
- Choice architecture
- The design of how options are presented, which influences choices.
- Default
- The outcome that occurs if a person takes no action.
- Change saturation
- A state in which people face more change than they can absorb.
- Change load heat map
- A grid of the impact of each change on each group over time, compared with capacity.
- Phased rollout
- Introducing a change one site or group at a time.
- Big bang
- Introducing a change everywhere at once.
Practice problems
Work each problem on paper first, then reveal the answer to check.
In the heat map code, what happens to store staff in Q1 if the new store scorecard is delayed to Q3? Is that a good idea?
Show answer
Their Q1 load falls from 4 to 3, but associates would then face the end of promotions while still paid on sales volume; the scorecard should stay with the promotions change.
Give an example of Kerr's folly from your own organization and propose a fix.
Show answer
For example, wanting cross-team collaboration but rewarding only individual targets; add a team or company component to bonuses and recognize collaborative work.
When is a big bang rollout the right choice?
Show answer
When running old and new systems side by side would be costly or dangerous, as with ledgers or safety systems, provided preparation and rehearsal are thorough.
List three ways to shape the path for Cedarline associates offering repair services.
Show answer
A point-of-sale prompt, a visible repair price list at the till and a one-minute booking process; retiring paper forms that slow it down.
Lesson quiz · 5 questions
Score 60% or more to complete this lesson.
Create a free account to save your progress, take quizzes and earn a certificate.