
MBA-613 · Lesson 3 of 12 · 23 min
Diagnosing organizations: models and data
A physician who prescribes before examining the patient is guilty of malpractice, Dr. Morin says, and a manager who launches a change before diagnosing the organization should be judged the same way. Yet that is what usually happens. A new executive arrives with a solution that worked at her last company. A consultant recommends the operating model he has sold to five other clients. A board reads about a competitor's restructuring and asks for one too. In each case the solution comes first and the diagnosis, if there is one, is assembled afterwards to justify it.
Diagnosis is the systematic study of how an organization works, why it produces the results it does and what would have to change to produce different results. It serves three purposes. It identifies the real problem, which is often not the one first presented. It reveals the connections between parts of the organization, so that a change in one place is matched by the changes it requires elsewhere. And, if done with the people involved, it builds the shared understanding and dissatisfaction that change needs. This lesson covers the main diagnostic models, the data used to fill them in and the craft of feeding findings back to the people who must act on them.
Organizations as open systems
Most diagnostic models share an assumption that dates from the 1960s work of Daniel Katz and Robert Kahn: organizations are open systems. They take inputs from their environment, such as customers' demands, capital, talent and regulation, transform them through work done by people organized in particular ways, and produce outputs that the environment rewards or punishes. The parts of the system are interdependent. A change in one, such as a new strategy, creates pressure on the others, such as structure, skills and rewards, and if they do not adjust, the system pulls the changed part back towards its old state.
This is why piecemeal changes so often disappoint. Cedarline's board has adopted a strategy built on durability and repair. If store associates are still paid bonuses on new-product sales, if planners are still measured on how much stock is available, and if the culture celebrates big launches rather than long-lasting products, the strategy will be quietly absorbed into business as usual. Diagnosis looks for these misfits before the change starts.
Weisbord’s six-box model
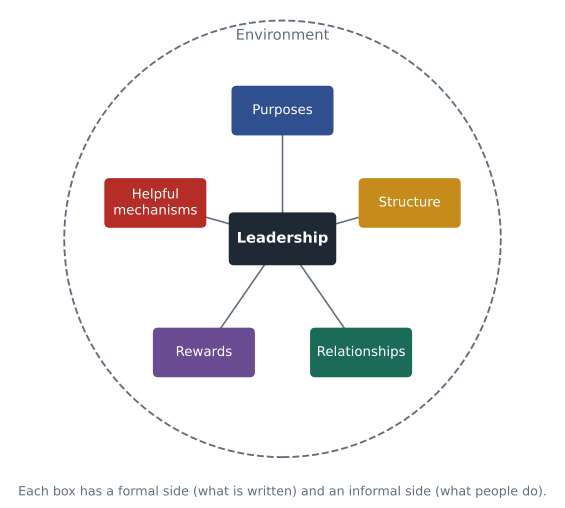
Marvin Weisbord's six-box model, published in 1976, remains popular because it is simple enough to use in a workshop. It asks about six areas. Purposes: what business are we in, and do people agree? Structure: how is work divided, and does the division fit the purpose? Relationships: how do people and units work together, and how is conflict handled? Rewards: are there incentives for doing what needs doing, formally and informally? Leadership: does someone keep the boxes in balance? Helpful mechanisms: do planning, budgeting, information and control systems help people coordinate, or get in the way? Around the boxes lies the environment, which makes demands on all of them.
For each box Weisbord distinguished the formal system, what is written down, from the informal system, what people actually do. The gaps between them are often where diagnosis finds the most useful clues. A formal structure may show a single operations organization at Prairie Ridge; informally, the gas and renewables teams may still route every decision through their old managers.
The congruence model
David Nadler and Michael Tushman's congruence model, published in 1980, is more demanding and more useful for strategic change. It begins with inputs: the environment, the organization's resources and its history. From these, leaders choose a strategy. The strategy is carried out by a transformation process with four components: the work itself, the people who do it, the formal organization of structures, systems and processes, and the informal organization of culture, norms, relationships and politics. The outputs are performance at the level of the organization, groups and individuals.
The central idea is fit, or congruence. The better the four components fit each other and the strategy, the better the organization performs. Diagnosis therefore asks pairwise questions. Does the formal organization match the demands of the work? Do people have the skills and motivations the work requires? Does the informal culture support or undermine the formal structures? Nadler and Tushman added a paradox: high congruence makes an organization effective in its current environment and resistant to change when the environment shifts. The tighter the fit, the harder the break.
Daniel applies the model to the robotic welding cells at Northfield. The work changes from manual welding to loading fixtures, monitoring the robot, checking weld quality and fixing small faults. The people are experienced welders who take pride in hand skills and are paid on a grade structure that rewards welding certification. The formal organization schedules work in fixed shifts of manual stations and measures supervisors on output per shift. The informal organization prizes speed and the ability to fix anything with a torch. Each of these fits the old work well and the new work badly. The cells will not reach their planned output unless job design, training, pay grades, scheduling and supervisors' measures change together.
The Burke–Litwin model
Warner Burke and George Litwin's 1992 model adds a distinction that matters for planning a change. It arranges twelve factors in a causal chain from the external environment down to individual and organizational performance. The upper factors, external environment, mission and strategy, leadership and organizational culture, are transformational: changing them alters the organization's direction and identity, usually in response to the environment, and generally requires new behaviour throughout. The lower factors, structure, management practices, systems, work unit climate, task requirements, individual skills, motivation and needs and values, are transactional: they concern the everyday exchanges between people and the organization and can be adjusted within the existing identity.
Burke and Litwin argued that transformational change must start with the upper factors, because changing structure or systems alone will not alter culture or strategy. Transactional change, by contrast, can start lower down. The model helps leaders recognize which kind of change they are attempting. Kestrel's growth from startup to established firm, Leo realizes, is transformational: the founders' leadership and the culture of improvisation must change, not just the org chart.
Gathering diagnostic data
A model tells the diagnostician what to look for; data tell what is actually there. Dr. Morin describes five sources, each with strengths and weaknesses. Surveys reach many people cheaply and allow comparisons between groups and over time, but they measure only what the questions ask, and people may answer cautiously if they distrust confidentiality. Interviews reveal reasons, stories and context, but they are slow and depend on the interviewer's skill and on who is chosen. Focus groups allow people to build on each other's views but can be dominated by a few voices. Observation shows what people actually do rather than what they say, and is often the best way to find informal systems, but it is time-consuming and the observer can change behaviour. Records and operational data, such as turnover, errors, cycle times and grievances, are objective but describe outcomes rather than causes.
Good diagnosis triangulates: it uses several sources and looks for patterns that appear in more than one. If an engagement survey shows low trust in management in Cedarline's distribution centre, interviews explain why, observation of a shift shows supervisors managing twenty-two people each with no time to coach, and records show turnover of 38 per cent a year, the diagnosis is robust. If only one source shows a pattern, it is a hypothesis to test.
Is the survey measuring anything?
Surveys are the workhorse of organizational diagnosis, and their scores are often treated with more confidence than they deserve. A scale that combines several questions, such as four items about trust in one's manager, is reliable only if the items measure the same thing. The standard measure of this internal consistency is Cronbach's alpha, introduced by the psychologist Lee Cronbach in 1951. Alpha rises with the number of items and with the correlation between them; values above about 0.7 are usually considered acceptable for group comparisons, and values much below that suggest that the items measure different things or that respondents interpret them differently.
Here k is the number of items, s with subscript i squared is the variance of item i and s with subscript T squared is the variance of respondents' total scores. If the items move together, the variance of the total is much larger than the sum of the item variances, and alpha approaches one. Owen's team ran a short survey at Prairie Ridge with three six-box scales, each of three items on a five-point scale. Dr. Morin shows how to check reliability and compare the two divisions.
# Reliability (Cronbach's alpha) and group comparison for a short diagnostic survey
from statistics import pvariance, mean

def alpha(rows):
    k = len(rows[0])
    items = list(zip(*rows))
    item_var = sum(pvariance(col) for col in items)
    total_var = pvariance([sum(r) for r in rows])
    return k / (k - 1) * (1 - item_var / total_var)

# Each row is one respondent's answers to three items (1 to 5)
survey = {
    "relationships": {
        "gas":        [(2,2,3),(3,2,2),(2,1,2),(3,3,3),(1,2,1),(2,2,2),(4,3,3),(2,3,2)],
        "renewables": [(4,4,3),(3,4,4),(4,5,4),(3,3,3),(5,4,4),(4,4,5),(3,4,3),(4,3,4)],
    },
    "rewards": {
        "gas":        [(3,3,3),(4,4,4),(2,2,3),(4,4,3),(3,3,3),(2,3,2),(4,3,4),(3,3,3)],
        "renewables": [(3,3,4),(4,4,4),(2,2,2),(3,4,3),(3,3,3),(4,4,3),(2,3,2),(3,3,3)],
    },
    "helpful mechanisms": {   # items: safety system, scheduling tools, shared data
        "gas":        [(5,2,1),(4,3,2),(5,2,2),(5,1,3),(4,2,1),(5,3,2),(4,2,2),(5,2,1)],
        "renewables": [(2,4,4),(3,4,5),(2,5,4),(3,3,4),(2,4,3),(1,4,4),(2,3,5),(3,4,4)],
    },
}
for scale, groups in survey.items():
    pooled = groups["gas"] + groups["renewables"]
    g = mean(sum(r) / 3 for r in groups["gas"])
    w = mean(sum(r) / 3 for r in groups["renewables"])
print(f"{scale:19s} alpha {alpha(pooled):5.2f} gas mean {g:4.2f} renewables mean {w:4.2f} gap {w - g:+5.2f}")relationships alpha 0.90 gas mean 2.29 renewables mean 3.79 gap +1.50 rewards alpha 0.85 gas mean 3.12 renewables mean 3.08 gap -0.04 helpful mechanisms alpha -2.86 gas mean 2.83 renewables mean 3.42 gap +0.58
The output contains a warning in numbers. The relationships scale is reliable, and the gap between the divisions is large: gas staff rate working relationships across the merged organization much lower than renewables staff do. The rewards scale is reliable and shows no meaningful difference, so pay and recognition are not the issue. The helpful mechanisms scale has a negative alpha, which is possible when items move in opposite directions. Its three items do not measure one thing. Looking at the raw answers explains why: gas staff rate the safety system highly and the shared data poorly, and renewables staff the reverse. Averaging the items would have hidden the most important finding, which is that each division trusts its own systems and distrusts the other's. Owen's team should report the items separately.
Feeding back the diagnosis
Diagnosis is not complete when the analysis is finished. In organization development the findings are fed back to the people who supplied the data, who interpret them, correct them and decide what to do. Peter Block, whose book Flawless Consulting appeared in 1981, argued that the feedback meeting is where commitment to change is won or lost. People who see their own data, presented honestly and without blame, are far more likely to act than people who receive a report.
Dr. Morin gives practical rules. Present a few findings clearly rather than many vaguely. Show the data behind each finding. Separate what the data show from your interpretation, and invite challenge. Do not hide uncomfortable findings about the people in the room, including the sponsor. End with questions about what the group wants to do, not with a complete set of recommendations. A diagnosis that is presented as a finished verdict invites defence; one that is presented as a shared puzzle invites problem solving.
Diagnosis also changes the system it studies. Asking people about their work signals that someone is paying attention and that change may be coming. It can raise hopes that will turn to cynicism if nothing follows. A diagnostic survey that is never acted on is worse than no survey, because it teaches people that their views do not matter. Leaders should start diagnosis only if they are prepared to act on what it finds.
Common traps
Several traps recur. The presenting problem trap is accepting the sponsor's definition of the problem without testing it; Hana was asked to find out why physicians resist the documentation system, but her interviews suggest that the system's drafts of specialist notes are often wrong, which is a vendor problem rather than resistance. The symptom trap is treating outcomes such as turnover as causes. The confirmation trap is looking only for evidence that supports a favoured solution. The single-source trap is relying on one survey. And the analysis paralysis trap is diagnosing so long that the moment for change passes; diagnosis should be good enough to act on, then refined as the change proceeds.
| Model | Elements | Main diagnostic question | Good for |
|---|---|---|---|
| Weisbord six-box | Purposes, structure, relationships, rewards, leadership, helpful mechanisms | Where do formal and informal systems diverge? | Workshops with managers and staff |
| Nadler–Tushman congruence | Inputs, strategy, work, people, formal and informal organization, outputs | Do the components fit each other and the strategy? | Strategic and structural change |
| Burke–Litwin | Twelve factors, transformational and transactional | Does the change require new mission, leadership and culture? | Distinguishing transformation from adjustment |
| McKinsey 7-S | Strategy, structure, systems, shared values, style, staff, skills | Are hard and soft elements aligned? | Design of the change (lesson 7) |
Worked problem
Diagnosing Cedarline's distribution centre
Cedarline's distribution centre has 520 employees, engagement of 14 per cent, turnover of 38 per cent and supervisors managing about 22 people each. A new warehouse management system, part of the digital roadmap, is planned for next year, and the first collective agreement includes a joint committee on pick rates. Use the congruence model to diagnose the readiness of the centre for the new system.
Show solution
- Work: the new system will direct pickers by handheld scanner, set pick paths and record performance in real time; work becomes more standardized and more visible.
- People: many pickers are recent hires because of high turnover; experienced staff distrust performance tracking after years of disputes about pick rates.
- Formal organization: spans of about 22 leave supervisors little time to train or coach; the collective agreement says scanner data may not be used for discipline without review and creates a joint pick-rate committee.
- Informal organization: low engagement and a history of conflict suggest that a system that records every movement will be read as surveillance unless the union and supervisors help shape how it is used.
- Fit: the new system fits the work but not the current people, supervision or culture; the agreement provides a formal channel, the joint committee, through which to rebuild fit.
Answer: The centre is not ready for the system as currently planned. The people strategy's reduction of spans to about 12, training for supervisors and early involvement of the joint committee in setting how scanner data will be used should come before, not after, the technical launch.
Common mistakes
MistakeWe know the problem; diagnosis is a delay.
InsteadThe presenting problem is often not the real one, and diagnosis done with the people involved builds the commitment that change requires.
MistakeA survey score is a measurement.
InsteadCheck reliability; a scale with low alpha may combine items that tell opposite stories.
MistakeDiagnosis is neutral.
InsteadAsking people about their work raises expectations; a diagnosis that is not acted on breeds cynicism.
MistakePresent a complete set of recommendations.
InsteadFeed back a few clear findings with data, invite challenge and let the group decide what to do.
Summary and key terms
- Diagnosis studies how an organization produces its results and what would have to change to produce different ones.
- Open systems thinking shows that parts of an organization are interdependent, so piecemeal change is pulled back by unchanged parts.
- Weisbord's six-box, Nadler and Tushman's congruence and Burke and Litwin's models offer different lenses; congruence emphasizes fit and its paradoxical resistance to change.
- Good diagnosis triangulates surveys, interviews, focus groups, observation and records, and checks the reliability of survey scales.
- Feedback of findings to the people involved is where commitment to change is won or lost.
- Open system
- An organization viewed as transforming inputs from its environment into outputs, with interdependent parts.
- Congruence
- The degree of fit between strategy, work, people and the formal and informal organization.
- Transformational factors
- In the Burke–Litwin model, environment, mission and strategy, leadership and culture.
- Transactional factors
- In the Burke–Litwin model, structure, practices, systems, climate and individual factors.
- Triangulation
- Using several data sources to confirm a finding.
- Cronbach’s alpha
- A measure of the internal consistency of a multi-item scale.
- Feedback meeting
- A session in which diagnostic findings are returned to the people who supplied the data.
Practice problems
Work each problem on paper first, then reveal the answer to check.
A four-item scale has item variances of 0.8, 0.9, 0.7 and 1.0, and the variance of the total score is 8.4. Calculate alpha.
Show answer
Alpha = 4/3 × (1 − 3.4/8.4) = 4/3 × 0.595 = about 0.79, which is acceptable.
Explain the congruence paradox in your own words.
Show answer
An organization whose parts fit its current strategy tightly performs well, but that same tight fit makes it hard to change any one part when the strategy must change.
Why did averaging the helpful mechanisms items at Prairie Ridge hide the key finding?
Show answer
The two divisions rated the items in opposite directions, so the averages looked similar while each group trusted only its own systems.
Name two signs that a diagnosis is suffering from the confirmation trap.
Show answer
Data collection is limited to sources likely to support the favoured solution, and contradictory findings are dismissed as noise rather than investigated.
Lesson quiz · 5 questions
Score 60% or more to complete this lesson.
Create a free account to save your progress, take quizzes and earn a certificate.