
MBA-613 · Lesson 11 of 12 · 23 min
Sustaining change: measurement, reinforcement and renewal
Every member of the cohort can name a change that worked for a while and then faded. Daniel remembers a lean program at Northfield that produced tidy work cells, visual boards and a forty per cent cut in changeover times, and that had largely disappeared two years later, after the plant manager who championed it retired. Hana remembers a hand hygiene campaign that lifted compliance to over ninety per cent during the audit months and saw it slip back once the auditors left. Owen remembers a reorganization at Prairie Ridge that was reversed by the next vice-president. Grace remembers three ordering systems at Fairway, two of them withdrawn. Dr. Morin says that sustaining change is the least glamorous and most neglected stage of the work, because by the time it matters the sponsor's attention has moved on and the change team has been disbanded.
This lesson covers why changes decay, how habits form, how to measure whether a change is holding, how to reinforce it through the organization's systems and how to know when a change should be renewed or ended rather than defended.
Why changes decay
David Buchanan and colleagues reviewed research on sustaining organizational change in 2005, in an article titled 'No Going Back'. They found that sustainability had been studied far less than implementation and that changes decay for many reasons, often in combination. Initiative decay occurs when a change's gains erode as attention fades and old habits return. Improvement evaporation occurs when gains are made in a pilot but not transferred. Changes also decay when the people who championed them leave, when the systems that reward old behaviour are left in place, when new priorities crowd them out, when the change is seen as belonging to a project team rather than to the line, and when the environment shifts so that the change no longer fits. Buchanan and colleagues also cautioned that sustainability is not always desirable: a change that is held in place too rigidly can become an obstacle to the next one. The aim is not permanence but durability with the ability to adapt.
The cohort's examples fit these patterns. Northfield's lean program depended on one champion and was never built into supervisors' roles or the plant's measures. Lakeview's hand hygiene compliance depended on audits rather than on routines and peer norms. Prairie Ridge's reorganization was owned by one executive. Fairway's earlier systems were never adopted widely enough for managers to believe they would last.
How habits form
Many changes ask people to replace one routine with another. Habits are behaviours triggered automatically by cues in a stable context, with little conscious thought. Once formed, they persist with little effort; until they are formed, the new behaviour depends on attention and willpower, which run out when people are busy or stressed. A 2009 study by Phillippa Lally and colleagues at University College London, published in the European Journal of Social Psychology in 2010, followed volunteers trying to form new daily habits, such as drinking water after breakfast or running before dinner. The time for the behaviour to reach most of its maximum automaticity varied enormously, from 18 to 254 days, with a median of 66. Simpler behaviours became automatic faster, and missing a single day did not materially harm the process.
The implication for change leaders is that support must last much longer than the launch. If associates at Cedarline are to offer a repair option with every sale, the behaviour will depend on prompts, reminders and coaching for at least two to three months, and longer for associates who work part-time and perform the routine less often. Support that is withdrawn after the four-week training period, as in Lakeview's experience with the documentation system, withdraws it during the most fragile phase. Habit research also suggests making the cue consistent, such as a prompt that appears on the point-of-sale screen at the same step of every transaction, and making the behaviour simple.
Forecasting adoption
Lessons 1 and 2 described adoption as an S-shaped curve. Frank Bass, a marketing professor, proposed in 1969 a model of how new products spread that has since been applied to many innovations, including management practices. It distinguishes two forces. Innovation, measured by a coefficient p, is the tendency of people to adopt on their own, influenced by external sources such as training or leaders' messages. Imitation, measured by a coefficient q, is the tendency to adopt because others already have, through word of mouth and observation. When q is much larger than p, as is usual, adoption starts slowly and then accelerates as adopters influence others.
Here F is the share of the target population that has adopted. The model is useful for two purposes in sustaining change. It sets realistic expectations: leaders who expect adoption to rise in a straight line will be alarmed by the slow start and may abandon a change that is about to accelerate. And it shows which lever matters. If imitation is strong, the most valuable investment is making early adopters' success visible; if imitation is weak, as when people work in isolation, external support must carry more of the load.
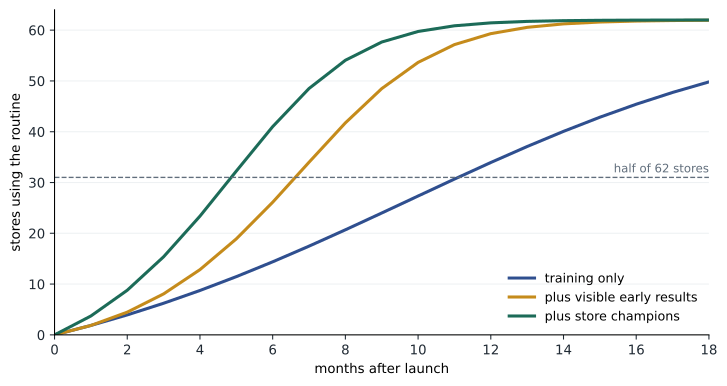
Cedarline launched the repair-offer routine in a pilot region of its 62 stores first. Dr. Morin shows how to compare scenarios for the remaining rollout.
# Bass diffusion of a new routine across Cedarline's 62 stores (monthly steps)
def bass(p, q, months, m=62):
    adopted, path = 0.0, []
    for t in range(months):
        f = adopted / m
        new = (p + q * f) * (m - adopted)
        adopted += new
        path.append(adopted)
    return path

scenarios = {
    "training only (weak imitation)":       (0.03, 0.15),
    "training plus visible early results":  (0.03, 0.45),
    "visible results plus store champions": (0.06, 0.45),
}
for name, (p, q) in scenarios.items():
    path = bass(p, q, 18)
    halfway = next((i + 1 for i, v in enumerate(path) if v >= 31), None)
    print(f"{name:38s} stores adopted at months 3, 6, 12, 18: "
f"{[round(path[i]) for i in (2, 5, 11, 17)]} reaches 31 stores in month {halfway}")training only (weak imitation) stores adopted at months 3, 6, 12, 18: [6, 14, 34, 50] reaches 31 stores in month 12 training plus visible early results stores adopted at months 3, 6, 12, 18: [8, 26, 59, 62] reaches 31 stores in month 7 visible results plus store champions stores adopted at months 3, 6, 12, 18: [15, 41, 61, 62] reaches 31 stores in month 5
The scenarios show why visible results matter so much. With training alone and weak imitation, half the stores have adopted the routine only after about a year. If early stores' results are shared, through a monthly league of repair bookings and stories from associates who have built a following of repeat customers, imitation strengthens and the halfway point arrives months earlier. Adding store champions, one experienced associate in each region who helps colleagues, raises the innovation coefficient as well and brings adoption forward again. The parameters are illustrative; Cedarline's transformation office can estimate them from the pilot region's monthly data and update the forecast as the rollout proceeds.
Measuring whether a change is holding
Once a change has been adopted, the question becomes whether it is holding. Simple before-and-after comparisons are misleading, because every process varies from week to week. A week with a low repair-offer rate may be bad luck or the start of decay. Walter Shewhart's control chart, developed at Bell Laboratories in the 1920s, distinguishes the two. It plots a measure over time against a centre line and control limits, usually set three standard deviations above and below the centre. Points within the limits reflect common-cause variation, the normal noise of a stable process. A point outside the limits, or a run of points on one side of the centre, signals special-cause variation: something has changed and should be investigated.
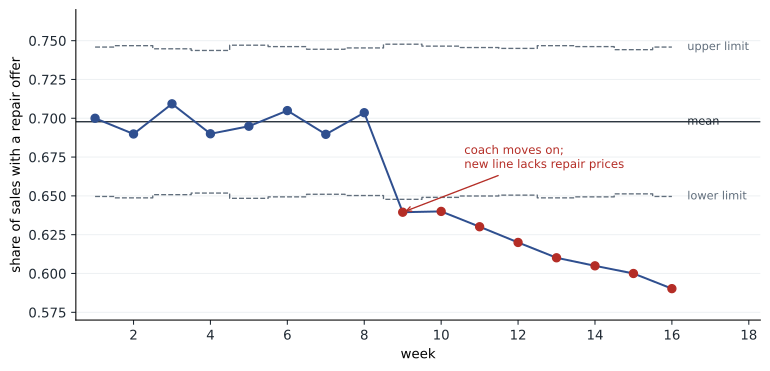
For a proportion, such as the share of sales in which associates offered a repair option, the appropriate chart is a p-chart. Its limits depend on the average proportion and the number of observations each period, so weeks with fewer sales have wider limits. Cedarline's pilot region recorded the weekly offer rate after the routine was established.
# p-chart: weekly share of sales with a repair option offered in the pilot region
import math
sales  = [820, 790, 860, 900, 780, 810, 870, 840, 760, 800, 830, 850, 790, 810, 880, 820]
offers = [574, 545, 610, 621, 542, 571, 600, 591, 486, 512, 523, 527, 482, 490, 528, 484]
weeks = len(sales)
baseline = 8   # use the first eight weeks, when the routine was established, to set the limits
p_bar = sum(offers[:baseline]) / sum(sales[:baseline])
print(f"mean line {p_bar:.3f}")
run = 0
for w in range(weeks):
    p = offers[w] / sales[w]
    se = math.sqrt(p_bar * (1 - p_bar) / sales[w])
    lo, hi = p_bar - 3 * se, p_bar + 3 * se
    run = run + 1 if p < p_bar else 0
    flag = ""
    if p < lo or p > hi:
        flag = "outside limits"
    elif run >= 8:
        flag = "run of 8 below the mean"
print(f"week {w + 1:2d}: rate {p:.3f} limits {lo:.3f} to {hi:.3f} {flag}")mean line 0.698 week 1: rate 0.700 limits 0.650 to 0.746 week 2: rate 0.690 limits 0.649 to 0.747 week 3: rate 0.709 limits 0.651 to 0.745 week 4: rate 0.690 limits 0.652 to 0.744 week 5: rate 0.695 limits 0.648 to 0.747 week 6: rate 0.705 limits 0.649 to 0.746 week 7: rate 0.690 limits 0.651 to 0.744 week 8: rate 0.704 limits 0.650 to 0.745 week 9: rate 0.639 limits 0.648 to 0.748 outside limits week 10: rate 0.640 limits 0.649 to 0.746 outside limits week 11: rate 0.630 limits 0.650 to 0.746 outside limits week 12: rate 0.620 limits 0.650 to 0.745 outside limits week 13: rate 0.610 limits 0.649 to 0.747 outside limits week 14: rate 0.605 limits 0.649 to 0.746 outside limits week 15: rate 0.600 limits 0.651 to 0.744 outside limits week 16: rate 0.590 limits 0.650 to 0.746 outside limits
For the first eight weeks the rate varies within its limits, as a stable process should. From week nine the rate falls, and every week from then on lies below the lower limit; the chart signals a special cause long before a monthly average would have. The transformation office's investigation finds that week nine was when the pilot region's district manager, who had coached store managers weekly, moved to a new role, and when a new seasonal product line arrived without repair prices in the point-of-sale system. Both causes are fixable. Without the chart, the decline might have been noticed only at the quarterly review, by which time associates would have stopped offering repairs and customers would have stopped expecting them.
Reinforcing change through systems
The most durable way to sustain a change is to make it part of the organization's ordinary systems, so that it no longer depends on a project team or a champion. Dr. Morin lists the systems to check. Roles and job descriptions should describe the new behaviour. Onboarding and training should teach it to new hires, so that the change does not depend on the people who were trained at launch. Standard work, such as checklists and procedures, should embed it. Performance reviews and scorecards should include it. Leaders' routine meetings should review it. Audits should check it, preferably by peers and supervisors rather than by outside inspectors. And when a change is fully embedded, the transformation office's tracking should be handed over to the function that owns the process.
Recognition matters too. People who sustain a change when the spotlight has moved deserve more recognition than those who launched it, and they rarely receive it. Stories of people who made the change work, told in leaders' meetings and newsletters, reinforce the new norm. Celebrations of milestones mark progress, but Kotter warned against declaring victory too soon: a premature celebration tells people that the work is done and invites the return of old habits.
Leadership transitions are a particular risk, as Daniel's and Owen's examples show. A change championed by one leader is vulnerable when that leader leaves, because the successor may have different priorities or want to make a mark. Organizations can reduce the risk by making sure changes are owned by several leaders, by including them in the handover of any role, by writing them into the strategy and budget rather than leaving them as a leader's personal project, and by briefing successors on the evidence for them.
Renewal and knowing when to stop
Sustaining a change does not mean defending it forever. Environments change, and a change that fitted last year's conditions may need adapting. The plan-do-check-act logic of lesson 10 applies here: a change that has been embedded should still be reviewed periodically against its purpose. Signs that a change needs renewal rather than reinforcement include a stable adoption rate with declining benefits, repeated workarounds by capable people, and complaints that point to a changed context rather than to habit.
There are also changes that should be stopped. Leaders find this hard, because stopping feels like failure and because of the escalation of commitment studied in MBA-604. But an organization that never stops anything accumulates initiatives until people cannot tell which matter, which is a recipe for change saturation. Dr. Morin recommends that every significant change has, from the start, a review date and criteria for continuing, adapting or stopping, as the digital roadmap in MBA-603 did with its rule that the board would revisit the channel targets if store inventory accuracy stayed below 95 per cent after a year. Stopping a change cleanly, explaining why and thanking those who worked on it is itself a signal that leaders take change seriously.
| Cause of decay | Example in the cases | Sustaining mechanism |
|---|---|---|
| Champion leaves | Northfield lean program after the plant manager retired | Several owners; written into roles, strategy and handovers |
| Behaviour depends on audits | Lakeview hand hygiene after audits ended | Routines, peer norms and supervisor checks |
| Support withdrawn too early | Lakeview documentation coaching cut in month five | Support for at least the habit-forming period |
| Old systems left in place | Planner bonuses on in-stock rates | Change measures and rewards with the process |
| Context changes | New product line without repair prices | Control charts to detect special causes; periodic review |
| Too many changes | Fairway’s three ordering systems in five years | Review dates and criteria to stop or adapt |
Worked problem
A sustainment plan for Cedarline's planning process
Cedarline's new sales and operations planning process was launched six months ago. Lesson 10's benefits tracking showed that planners' adoption is at about two-thirds of plan, and many still build forecasts in old spreadsheets. Design a sustainment plan.
Show solution
- Diagnose with ADKAR: interviews show planners know the process (knowledge) but find the new forecasting tool slow for long-tail items (ability) and still have bonuses tied to in-stock rates (reinforcement).
- Fix the path: retire the old spreadsheets' data feeds, so that the new tool is the only source of current sales data, and ask the vendor to speed up long-tail forecasting.
- Fix reinforcement: introduce the balanced planner goals from the people strategy at the next bonus cycle, weighting in-stock rate, inventory turns and markdowns.
- Embed: add the monthly planning meeting to the chief operating officer's standing calendar, include process use in planners' reviews and include the process in onboarding for the three new planners.
- Measure: track the share of forecasts made in the new tool weekly on a control chart; review forecast accuracy and markdowns quarterly.
- Review: set a date in nine months to decide whether to adapt the process for long-tail items, with criteria agreed now.
Answer: The plan addresses the specific gaps in ability and reinforcement, removes the old path, embeds the process in ordinary systems and sets a review date. It treats the slow adoption as information rather than as resistance.
Common mistakes
MistakeOnce adopted, a change will hold.
InsteadChanges decay when attention fades, champions leave or old systems remain; sustaining requires deliberate mechanisms.
MistakeHabits form in a few weeks.
InsteadLally's study found a median of 66 days and a range up to 254; support must outlast the launch.
MistakeA bad week means the change is failing.
InsteadControl charts distinguish normal variation from special causes that need investigation.
MistakeA sustained change should be defended forever.
InsteadChanges should be reviewed and adapted or stopped when the context shifts.
Summary and key terms
- Changes decay through fading attention, departing champions, unchanged systems, crowding priorities and shifting contexts.
- Habits take weeks to months to form, with wide variation, so support must outlast the launch.
- The Bass model separates adoption driven by external influence from adoption driven by imitation and shows the value of visible early success.
- Control charts distinguish common-cause variation from special causes and detect decay early.
- Durable change is embedded in roles, onboarding, standard work, measures and leaders' routines, and is periodically reviewed for renewal or ending.
- Initiative decay
- The erosion of a change’s gains as attention fades and old habits return.
- Habit
- A behaviour triggered automatically by cues in a stable context.
- Bass diffusion model
- A model of adoption driven by innovation (p) and imitation (q).
- Control chart
- A chart of a measure over time with control limits that separate normal variation from special causes.
- p-chart
- A control chart for proportions, with limits that depend on the sample size.
- Special-cause variation
- Variation from an identifiable change in the process, signalled by points outside limits or unusual runs.
Practice problems
Work each problem on paper first, then reveal the answer to check.
A p-chart has a centre line of 0.70 and a week with 800 observations. What are its three-sigma limits?
Show answer
The standard error is the square root of 0.70 × 0.30 / 800, about 0.0162, so the limits are about 0.651 and 0.749.
In the Bass code, what happens if p is 0.10 and q is 0.15? Which lever is doing the work?
Show answer
Adoption starts faster but accelerates less; external influence such as training is carrying the load rather than word of mouth.
Give two ways to protect a change from the departure of its champion.
Show answer
Share ownership among several leaders and write the change into the role's handover, strategy and budget.
What criteria might tell Cedarline to adapt rather than reinforce the repair-offer routine?
Show answer
Offer rates stable but bookings and margins falling, associates repeatedly skipping the offer for certain products, or customers' feedback that the offer is unwelcome for some purchases.
Lesson quiz · 5 questions
Score 60% or more to complete this lesson.
Create a free account to save your progress, take quizzes and earn a certificate.