
JS-230 · Lesson 11 of 12 · 32 min
Logging and debugging
▶ Video coming soon A video version of this lesson is on the way.
On Tuesday, April 11, the partner service runs on the staging server for the first time, and Rosa places a test order from the kitchen tablet. The form shows an error. On her laptop, Mira would open the console, but on the server there is no console to open. "So what happened?" Rosa asks. Theo pulls up the service's log and reads one line: a 409 for request r-6f2a, because the tablet's clock had sent a date in the wrong format and the validator had refused it. "That line took you thirty seconds," Gareth says. "Without it, you would still be guessing. Today we decide what goes in the log, what never does, and how to find bugs when the log is not enough."
This lesson is about seeing what a server is doing. It explains why console.log is not enough on a server, and how structured logs, one JSON object per event with a level and named fields, make logs searchable. It sets up the pino logger with one access line per request, carries the request id into every line, including from code that has no request object, and keeps secrets and personal details out of the logs. The second half is about debugging: reading stack traces, inspecting values, attaching Chrome's debugger to a running Node process and checking a server's health.
Why logs, and why not console.log
A server's log is the record of what it did: requests received and answered, orders placed, rules applied, warnings and errors. When something goes wrong, it is often the only evidence, and sometimes it is needed weeks later, when an agency asks why an order was refused. console.log can write to the log, because whatever a service writes to its standard output ends up in the system's log store, but plain text lines have three problems on a server.
- They are hard to search. A line such as "order 17 placed for northside" cannot easily be filtered for every order from Northside, or every request slower than a second.
- They have no level. There is no way to show only warnings and errors in production while keeping detail for development.
- They lose context. A line from the repository does not say which request it belongs to, so lines from two requests that run at the same time are mixed together.
A structured log fixes all three. Every line is a JSON object with standard fields, such as time, level, msg and requestId, and any extra fields the event needs. Tools can filter and count by any field, and a person can still read each line.
{"level":30,"time":"2028-04-11T15:20:07.118Z","service":"partner-orders","reqId":"r-6f2a","partner":"kitchen","req":{"method":"POST","url":"/api/partners/v1/orders"},"res":{"statusCode":422},"responseTime":4,"msg":"request completed"}What this code does
Each property can be searched on its own: Theo can ask for every line with a statusCode of 422, every line for the kitchen, or every request slower than 500 ms. The level number 30 is pino's code for info, and the time is in UTC with milliseconds. The line says what happened without including the order itself or any key.
Levels
Each log line has a level that says how important it is. The service sets a minimum level from its configuration, LOG_LEVEL, and lines below it are not written. Production runs at info; Mira's laptop runs at debug; tests run at warn so their output stays readable.
| Level | pino number | Used for | Example |
|---|---|---|---|
| debug | 20 | Detail for developers, off in production | capacity check: 31 of 40 used |
| info | 30 | Normal events worth a record | order placed, request completed |
| warn | 40 | Something unusual that was handled | refused order after cut-off, 429 from rate limit |
| error | 50 | Something failed and needs attention | database unreachable, unexpected exception |
| fatal | 60 | The process is about to stop | invalid configuration at start-up |
Choosing the level well matters more than it seems. If ordinary refused orders were logged as errors, the error count would be meaningless and real errors would hide among them. A useful test is to ask whether someone should be woken up by it: errors yes, warnings no, and everything else certainly not.
The example builds a small structured logger with levels and child loggers. A child logger carries extra fields, such as the request id, into every line it writes, so code that handles one request never has to repeat them. The clock is passed in so the output is the same every time it runs.
const LEVELS = { debug: 20, info: 30, warn: 40, error: 50 };

function createLogger({ level = 'info', fields = {}, now = () => new Date().toISOString(), write = console.log } = {}) {
  const min = LEVELS[level];
  const log = (lvl) => (extra, msg) => {
    if (typeof extra === 'string') { msg = extra; extra = {}; }
    if (LEVELS[lvl] < min) return;
    write(JSON.stringify({ level: lvl, time: now(), ...fields, ...extra, msg }));
  };
  return {
    debug: log('debug'), info: log('info'), warn: log('warn'), error: log('error'),
    child: (more) => createLogger({ level, fields: { ...fields, ...more }, now, write }),
  };
}

let t = 0;
const logger = createLogger({ level: 'info', fields: { service: 'partner-orders' }, now: () => `2028-04-11T15:20:0${t++}.000Z` });
logger.info('service started');
const reqLog = logger.child({ reqId: 'r-6f2a', partner: 'kitchen' });
reqLog.debug({ used: 31 }, 'capacity checked');          // below info: not written
reqLog.warn({ field: 'deliveryDate' }, 'order refused');
reqLog.info({ statusCode: 422, responseTime: 4 }, 'request completed');{"level":"info","time":"2028-04-11T15:20:00.000Z","service":"partner-orders","msg":"service started"}
{"level":"warn","time":"2028-04-11T15:20:01.000Z","service":"partner-orders","reqId":"r-6f2a","partner":"kitchen","field":"deliveryDate","msg":"order refused"}
{"level":"info","time":"2028-04-11T15:20:02.000Z","service":"partner-orders","reqId":"r-6f2a","partner":"kitchen","statusCode":422,"responseTime":4,"msg":"request completed"}What this code does
createLogger returns one function per level, and each writes a JSON line only if its level is at or above the minimum, so the debug line is dropped at info. child creates a new logger with extra fields merged in, which is how every line about one request carries its reqId and partner without the code repeating them. The time comes from the now function, which a real logger reads from the clock.
pino and one line per request
The partner service uses pino, a fast structured logger for Node, and pino-http, its middleware that writes one line when each request finishes, with the method, URL, status code and response time. This access log answers most questions on its own: what was asked, by whom, what was answered and how long it took. pino-http also gives each request a child logger, req.log, so lines written by handlers carry the same request id.
// src/logger.js
import pino from 'pino';
import { config } from './config.js';

export const logger = pino({
  level: config.logLevel,
  base: { service: 'partner-orders' },
  redact: {
    paths: ['req.headers.authorization', 'req.headers.cookie', '*.apiKey', '*.password', 'config.databaseUrl'],
    censor: '[hidden]',
  },
});

// src/app.js (extract)
import { pinoHttp } from 'pino-http';
import { logger } from './logger.js';

app.use(pinoHttp({
  logger,
  genReqId: (req) => req.id,                       // the id from the requestId middleware
  customProps: (req) => ({ partner: req.partner?.slug }),
  customLogLevel: (req, res, err) => (err || res.statusCode >= 500 ? 'error' : res.statusCode >= 400 ? 'warn' : 'info'),
}));

// in a handler: req.log is a child logger that already carries the request id
req.log.info({ orderId: order.id, deliveryDate: order.deliveryDate, trays }, 'order placed');
What this code does
The logger takes its level from the configuration, adds the service name to every line and replaces any secret fields with [hidden] before writing. pino-http reuses the request id from Lesson 5, adds the partner's slug and chooses the level from the outcome, so refused requests are warnings and failures are errors. In a handler, req.log.info writes a line that already carries the request id and partner, with the order's id, date and tray count as searchable fields.
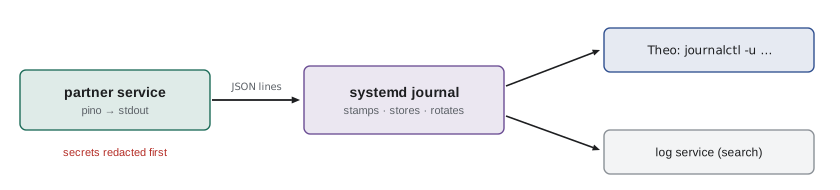
pino writes JSON to standard output and does nothing else, which is deliberate. On the server, systemd's journal collects the output of every service, stamps it, rotates old entries and lets Theo search it; from there it can be shipped to a log service. A Node program should not open its own log files, rotate them or send logs over the network inside the request path, because each of those can fail or slow the service down. In development, piping the output through pino-pretty turns the JSON into readable coloured lines.
Context without passing it around
Some code that writes logs has no request object: the repository, a helper that sends an email, a function three calls deep. Passing req.log through every function works but clutters every signature. Node has a built-in way to carry context through asynchronous code: AsyncLocalStorage from node:async_hooks. A value stored with run(store, fn) is available to everything fn calls, including code that runs later after an await, and two requests running at the same time each see their own value.
import { AsyncLocalStorage } from 'node:async_hooks';

const context = new AsyncLocalStorage();
const log = (msg) => {
  const ctx = context.getStore() ?? {};
  console.log(JSON.stringify({ msg, requestId: ctx.requestId, partner: ctx.partner }));
};

async function saveOrder() {
  await new Promise((r) => setTimeout(r, 10)); // pretend to talk to the database
  log('order saved');                            // no request object passed in, yet the id is known
}

async function handle(requestId, partner) {
  return context.run({ requestId, partner }, async () => {
    log('request started');
    await saveOrder();
  });
}

await Promise.all([handle('r-101', 'northside'), handle('r-102', 'elm-seniors')]);
log('outside any request');
What this code does
context.run starts each request with its own store holding the request id and partner, and everything inside it, including saveOrder after its await, can read that store with getStore. The two requests run at the same time, yet each log line has the right id, because the store follows the asynchronous work that started inside run. A log written outside any request has no store, so its fields are missing.
$ node context.mjs
{"msg":"request started","requestId":"r-101","partner":"northside"}
{"msg":"request started","requestId":"r-102","partner":"elm-seniors"}
{"msg":"order saved","requestId":"r-101","partner":"northside"}
{"msg":"order saved","requestId":"r-102","partner":"elm-seniors"}
{"msg":"outside any request"}
The service uses this sparingly: one store per request, set by a middleware right after requestId, holding the request id and the partner's slug, and read only by the logger. Everything else, such as which partner's orders to load, is still passed explicitly, because hidden inputs make code harder to understand and test.
What never goes in a log
Logs are copied, kept for months and read by more people and programs than the database is, so they must not contain anything that would harm someone if they leaked. The service's rules: no secrets at all, which means no API keys, passwords, database URLs with passwords or Authorization headers; no more personal information than needed, which means agency slugs and order ids but not the names of shelter staff or the notes on an order, which sometimes mention individuals; and no full request bodies by default. pino's redact option is the safety net for anything that slips through.
function redact(value, secretKeys = ['authorization', 'apikey', 'password', 'databaseurl', 'cookie']) {
  if (Array.isArray(value)) return value.map((v) => redact(v, secretKeys));
  if (value === null || typeof value !== 'object') return value;
  const out = {};
  for (const [k, v] of Object.entries(value)) {
    out[k] = secretKeys.includes(k.toLowerCase()) ? '[hidden]' : redact(v, secretKeys);
  }
  return out;
}

const line = {
  msg: 'request completed',
  req: { method: 'POST', url: '/api/partners/v1/orders', headers: { 'content-type': 'application/json', authorization: 'Bearer pk_live_9d1e...' } },
  partner: { slug: 'northside', apiKey: 'pk_live_9d1e...' },
  config: { port: 3100, databaseUrl: 'postgres://partner_app:s3cret@db.internal/hub' },
};
console.log(JSON.stringify(redact(line), null, 1));{
"msg": "request completed",
"req": {
"method": "POST",
"url": "/api/partners/v1/orders",
"headers": {
"content-type": "application/json",
"authorization": "[hidden]"
}
},
"partner": {
"slug": "northside",
"apiKey": "[hidden]"
},
"config": {
"port": 3100,
"databaseUrl": "[hidden]"
}
}What this code does
redact walks through objects and arrays and replaces the value of any key in the list with [hidden], whatever its letter case and however deeply it is nested. The Authorization header, the API key and the database URL with its password all disappear, while the method, URL, slug and port remain useful. pino does the same job with a list of paths, and does it before the line is ever written.
Errors need the same care. An error object logged with pino includes its type, message and stack trace, which is exactly what the log needs, but some errors carry more: a database driver's error can include the failed query's parameters. The service's error handler logs the error and the request id and leaves the parameters out.
Reading a stack trace
When an unexpected error reaches the error handler, its stack trace shows how the program got there: the error's type and message, then one line per function call, the most recent first, each with a file name, line number and column. The first line that points into the service's own code, rather than Node's internals or a package, is usually where to start.
function traysFor(order) {
  return order.lines.reduce((sum, l) => sum + l.trays, 0);
}

function daySheet(orders) {
  return orders.map((o) => ({ partner: o.partner, trays: traysFor(o) }));
}

daySheet([
  { partner: 'northside', lines: [{ item: 'soup', trays: 4 }] },
  { partner: 'elm-seniors' },
]);
What this code does
daySheet maps over the orders and calls traysFor for each one, which reads order.lines. The second order has no lines property, so reduce is called on undefined and the program stops with a TypeError. The stack trace reads from the top: the error, then traysFor at line 2, called from the map callback in daySheet at line 6, called from the top of the file at line 9.
$ node day-sheet.mjs
file:///home/mira/partner-orders/day-sheet.mjs:2
  return order.lines.reduce((sum, l) => sum + l.trays, 0);
                     ^

TypeError: Cannot read properties of undefined (reading 'reduce')
    at traysFor (file:///home/mira/partner-orders/day-sheet.mjs:2:22)
    at file:///home/mira/partner-orders/day-sheet.mjs:6:58
    at Array.map (<anonymous>)
    at daySheet (file:///home/mira/partner-orders/day-sheet.mjs:6:17)
    at file:///home/mira/partner-orders/day-sheet.mjs:9:1
The trace says exactly where it broke and how it got there, but not why the second order had no lines. That question leads back to the data: in this case, a draft order saved by an earlier version of the code. Two habits make traces more useful. Give functions names, so the trace does not say anonymous at every step. And when the code is compiled, such as TypeScript, run Node with --enable-source-maps so the trace points to the original source lines.
Looking at values
console.log of an object in Node uses util.inspect, which shows nested objects only two levels deep by default and replaces deeper levels with [Object]. That is fine for a glance but hides exactly the detail that matters in a complicated order. util.inspect with depth: null shows everything, and JSON.stringify shows what would be sent over the network, which differs for Dates, undefined values and Maps.
import util from 'node:util';

const order = { id: 17, lines: [{ item: 'soup', trays: 4, notes: { kitchen: { prep: 'day before' } } }] };
console.log(order);
console.log(util.inspect(order, { depth: null }));
console.log(JSON.stringify(order));
What this code does
The default console.log stops at two levels and prints [Object] for the kitchen notes. util.inspect with depth set to null prints the whole structure, and JSON.stringify prints a single line in the exact form a client would receive. Knowing which view is being looked at avoids chasing a value that is only hidden by the display.
$ node inspect.mjs
{ id: 17, lines: [ { item: 'soup', trays: 4, notes: [Object] } ] }
{
  id: 17,
  lines: [
    {
      item: 'soup',
      trays: 4,
      notes: { kitchen: { prep: 'day before' } }
    }
  ]
}
{"id":17,"lines":[{"item":"soup","trays":4,"notes":{"kitchen":{"prep":"day before"}}}]}
A debugger for Node
Logs answer "what happened"; a debugger answers "what is happening right now". Node includes the same debugging protocol as Chrome, so Chrome's DevTools, or the debugger in an editor such as VS Code, can attach to a Node process. Starting Node with --inspect opens a debugging port on the local computer; --inspect-brk also pauses before the first line, so breakpoints can be set before anything runs.
node --inspect-brk src/server.jsDebugger listening on ws://127.0.0.1:9229/4a6b1e7c-2f0d-4c1e-9a55-8c3f1d2e7b90 For help, see: https://nodejs.org/en/docs/inspector
What this code does
Node prints the address of its debugging endpoint and waits. Opening chrome://inspect in Chrome lists the process under Remote Target, and clicking inspect opens DevTools with the service's source, where breakpoints, the call stack and every variable can be examined. node --test --inspect-brk does the same for a single test file, which is often the quickest way to understand a failing test.
In DevTools the same tools Mira used for the browser apply: breakpoints that pause on a line, conditional breakpoints that pause only when, for example, partner === 'westview', stepping into and over calls, the scope panel showing every variable and a console that runs code in the paused function's scope. A debugger statement in the code acts as a breakpoint when a debugger is attached and does nothing otherwise, which makes it handy, but it must not be committed.
The inspector port gives full control over the process, so it must never be reachable from outside the computer. Node binds it to 127.0.0.1 by default, and the service on the server is never started with --inspect. To debug a problem that only happens in production, Theo copies the relevant log lines and Mira reproduces the request locally with the same data.
Is the service healthy?
A last kind of visibility is a health check: a route, GET /healthz in the partner service, that Theo's monitoring calls every minute. It answers 200 with a small JSON body when the service can do its job, which includes reaching the database with a trivial query, and 503 when it cannot. It needs no API key, and it reveals nothing beyond up or down. Theo's monitoring texts him if it fails three times in a row. Request counts, error rates and response times can be worked out from the access log, which is the next example.
const lines = [
  { status: 201, ms: 18 }, { status: 200, ms: 6 }, { status: 409, ms: 9 }, { status: 200, ms: 5 },
  { status: 200, ms: 7 }, { status: 500, ms: 31 }, { status: 201, ms: 22 }, { status: 422, ms: 3 },
  { status: 200, ms: 6 }, { status: 200, ms: 140 }, { status: 401, ms: 2 }, { status: 200, ms: 8 },
];

const byClass = {};
for (const l of lines) {
  const cls = `${Math.floor(l.status / 100)}xx`;
  byClass[cls] = (byClass[cls] ?? 0) + 1;
}
const sorted = lines.map((l) => l.ms).sort((a, b) => a - b);
const pct = (p) => sorted[Math.ceil((p / 100) * sorted.length) - 1];
console.log('requests:', lines.length, byClass);
console.log('server errors per 100 requests:', Math.round((byClass['5xx'] ?? 0) / lines.length * 1000) / 10);
console.log('median', pct(50), 'ms, 95th percentile', pct(95), 'ms, slowest', sorted.at(-1), 'ms');requests: 12 { "2xx": 8, "4xx": 3, "5xx": 1 }
server errors per 100 requests: 8.3
median 7 ms, 95th percentile 140 ms, slowest 140 msWhat this code does
The access log lines are counted by status class: 2xx successes, 4xx client errors such as refused orders and 5xx server errors. Client errors are normal and mostly mean the rules worked; server errors are the number to watch. The value printed for 95 is the time within which 95 in 100 requests finished, which describes what agencies experience far better than an average pulled up by one slow request.
Worked problem
How much log does the service write?
The partner service handles about 900 requests a day: the three agencies' forms and Rosa's kitchen screen, which refreshes every minute during kitchen hours. Each access line is about 350 bytes, and about 1 in 10 requests also writes one handler line of about 200 bytes. How much log is that per day and per year, and is it a problem?
Show solution
- Access lines: 900 × 350 = 315,000 bytes.
- Handler lines: 90 × 200 = 18,000 bytes.
- Per day: 315,000 + 18,000 = 333,000 bytes ≈ 0.33 MB.
- Per year: 0.333 × 365 ≈ 122 MB.
Answer: About a third of a megabyte a day and about 120 MB a year, which is small. Theo keeps 90 days in the journal, about 30 MB, and the service can afford to log every request at info level.
Common mistakes
Mistakeconsole.log is fine for a server's log.
InsteadUse structured JSON lines with levels and fields, so logs can be filtered and searched.
MistakeRefused orders should be logged as errors.
InsteadThey are normal outcomes of the rules. Errors are for failures that need attention; refusals are warnings or info.
MistakeLogging the whole request helps debugging.
InsteadIt leaks keys and personal details. Log ids and outcomes, and redact secret fields.
MistakeRunning the production server with --inspect makes debugging easier.
InsteadThe inspector gives full control of the process. Reproduce the problem locally instead.
Summary and key terms
- A server's log is often the only record of what it did, so it is written as structured JSON lines with a level, a time, a message and named fields such as the request id, partner, status and duration.
- Levels from debug to fatal separate detail from problems, and the minimum level comes from configuration. pino writes these lines quickly to standard output, pino-http writes one access line per request, and child loggers carry the request's fields into every line; AsyncLocalStorage can supply the request id to code that has no request object.
- The journal on the server collects and rotates the output.
- Logs never contain secrets or unnecessary personal details, and redaction hides any that slip through.
- Stack traces show where an error happened, util.inspect shows nested values, and node --inspect lets Chrome DevTools debug a local process.
- A health check and numbers from the access log show whether the service is working.
- Log
- The record of what a program did, written as it runs.
- Structured log
- A log in which each line is a data object, usually JSON, with named fields.
- Log level
- The importance of a log line, such as debug, info, warn or error.
- Child logger
- A logger that adds fixed fields, such as a request id, to every line it writes.
- Access log
- One log line per request with its method, path, status and duration.
- pino
- A fast structured logging library for Node.js.
- AsyncLocalStorage
- A Node feature that carries a value through asynchronous code started inside run().
- Redaction
- Replacing secret or personal values in log lines before they are written.
- Stack trace
- The list of function calls, most recent first, that led to an error.
- Health check
- A route that reports whether a service can do its job, for monitoring.
Practice problems
Work each problem on paper first, then reveal the answer to check.
Give two reasons why plain console.log lines are hard to use on a server.
Show answer
They cannot be searched by field, and they have no level; they also lose which request they belong to.
At which level should a refused order after the cut-off be logged?
Show answer
warn or info, not error, because the rule worked as intended.
What does a child logger add?
Show answer
Fixed fields, such as the request id and partner, on every line it writes.
Name three things that must never appear in the service's logs.
Show answer
API keys, passwords or database URLs with passwords, and Authorization headers.
Why is the 95th percentile more useful than the average response time?
Show answer
It shows what nearly all requests experience, without being pulled up or down by a few unusual ones.
Try it yourself
Redact by path
Complete redactPaths(obj, paths). Each path is a dot-separated list of keys, such as req.headers.authorization. Return a copy of obj in which the value at each existing path is replaced with [hidden].
Paths that do not exist are ignored. The original object must not change.
function redactPaths(obj, paths) {
  return obj;
}

const line = { msg: 'request completed', req: { method: 'POST', headers: { authorization: 'Bearer pk_live_9d1e', accept: '*/*' } }, partner: { slug: 'westview', apiKey: 'pk_live_9d1e' } };
const out = redactPaths(line, ['req.headers.authorization', 'partner.apiKey', 'req.body.password', 'config.databaseUrl']);
console.log(JSON.stringify(out));
console.log('original still has the key:', line.partner.apiKey === 'pk_live_9d1e');
Try it yourself
Summarize response times
Complete summary(ms) for an array of response times in milliseconds. It returns { count, median, p95, max }, using the nearest-rank method: sort the times, and the p-th percentile is the value at position ceil(p/100 × count), counting from 1.
For an empty array, return { count: 0, median: null, p95: null, max: null }. Do not change the array you are given.
function summary(ms) {
  return { count: ms.length };
}

console.log(summary([18, 6, 9, 5, 7, 31, 22, 3, 6, 140, 2, 8]));
console.log(summary([12]));
console.log(summary([]));
const times = [30, 10, 20];
summary(times);
console.log(times);
Lesson quiz · 5 questions
Score 60% or more to complete this lesson.
Create a free account to save your progress, take quizzes and earn a certificate.