
FIN-201 · Lesson 6 of 12 · 32 min
Stock valuation
A share of common stock is a claim on whatever is left of a company's cash flows after it pays its suppliers, employees, lenders and taxes. Unlike a bond, a share has no promised payments and no maturity; its value depends entirely on expectations about an uncertain future. Yet the same valuation principle applies: a share is worth the present value of the cash it is expected to deliver to its owner, discounted at a rate that reflects its risk. This lesson develops the dividend discount model, connects growth to reinvestment, values firms from their free cash flows, and explains how analysts use valuation multiples. It is not a guide to picking investments; it shows how financial managers and investors think about what equity is worth, which in turn tells a firm what its decisions do to its share price and what return its shareholders require.
Common and preferred shares
Common shareholders own the residual claim: they receive dividends if the board declares them, vote on directors and major transactions, and receive whatever remains after all other claims if the firm is liquidated. Their liability is limited to their investment. Some companies issue several classes of common shares with different voting rights. Dual-class structures, where founders or families keep control through multiple-voting shares, are relatively common among Canadian listed companies and increasingly common among US technology listings; they protect long-term strategies but weaken the accountability mechanisms described in lesson 1, as BUS-310 discusses.
Preferred shares sit between debt and common equity. They usually pay a fixed dividend that must be paid before any common dividend, and unpaid dividends on cumulative preferred shares accumulate. But preferred dividends are not a legal obligation like interest, and preferred holders usually cannot vote. A perpetual preferred share paying a fixed dividend is valued as a perpetuity, \( P = D/r \), so its required return is simply \( D/P \).
The dividend discount model
An investor who buys a share and holds it for a year receives a dividend and the price at the end of the year. That future price, in turn, depends on dividends after that year and the price after that, and so on. Carrying the argument forward, the price today equals the present value of all expected future dividends. If dividends are expected to grow at a constant rate \( g \) forever, the growing perpetuity formula from lesson 4 gives the constant-growth dividend discount model, often called the Gordon growth model.
Rearranging the Gordon formula shows that the required return is the dividend yield plus the growth rate: \( r = D_1/P_0 + g \). That decomposition is useful in reverse: given a share price, a forecast dividend and a growth rate, it estimates the return investors expect, one way of estimating the cost of equity in lesson 11.
Worked problem
Applying the Gordon model
A utility just paid an annual dividend of $2.40 per share. Dividends are expected to grow 3.5 % a year indefinitely, and investors require 8 % on shares of this risk. What is the share worth? If the market price is $52, what return does the market imply?
Show solution
- D₁ = 2.40 × 1.035 = 2.484.
- P₀ = 2.484 ÷ (0.08 − 0.035) = 55.20.
- Implied return at $52: r = 2.484 ÷ 52 + 0.035 = 0.0478 + 0.035 = 8.28 %.
Answer: The model values the share at $55.20. At $52, investors appear to require slightly more than 8 %, or to expect slower growth.
Where growth comes from
Dividends can only grow if the firm reinvests some of its earnings in projects that earn a return. If a firm retains a fraction \( b \) of its earnings (the plowback or retention ratio) and earns a return on equity of ROE on new investment, earnings and dividends grow at the sustainable growth rate \( g = b \times ROE \). Growth is therefore not free: it is bought by paying out less today.
Whether that trade is worth it depends on whether the new investments earn more than the cost of equity. Split the share price into two parts: the value of the current earnings stream if the firm paid out everything and stopped growing, \( EPS_1/r \), and the present value of growth opportunities (PVGO). If reinvested earnings earn exactly \( r \), PVGO is zero and retention neither creates nor destroys value. If they earn more, PVGO is positive; if less, growth destroys value even though earnings rise.
Worked problem
Growth that does and does not create value
A company expects earnings per share of $5.00 next year. Its cost of equity is 10 %. It can pay out all its earnings, or retain 40 % and reinvest at an ROE of either 15 % or 8 %. Value the shares in each case.
Show solution
- No growth: P = 5.00 ÷ 0.10 = 50.00.
- Retain 40 % at 15 %: g = 0.4 × 0.15 = 6 %; D₁ = 3.00; P = 3.00 ÷ (0.10 − 0.06) = 75.00; PVGO = 25.00.
- Retain 40 % at 8 %: g = 0.4 × 0.08 = 3.2 %; D₁ = 3.00; P = 3.00 ÷ (0.10 − 0.032) = 44.12; PVGO = −5.88.
Answer: Reinvesting at 15 % adds $25 per share; reinvesting at 8 %, below the 10 % cost of equity, destroys $5.88 per share even though earnings grow.
Non-constant growth
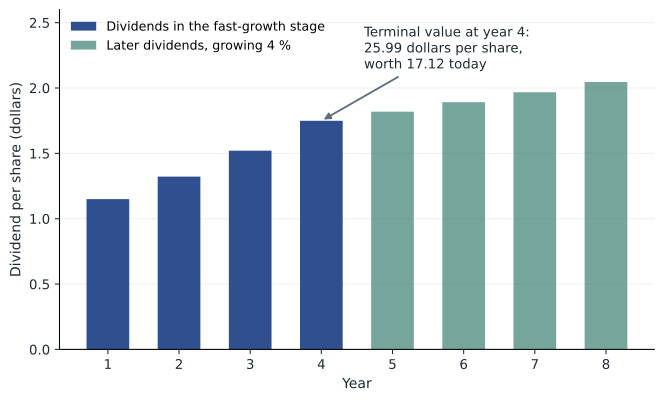
Young firms often grow quickly for some years before settling to a steady rate, and many pay no dividends at first. A two-stage (or multi-stage) model forecasts dividends year by year during the fast-growth period, then uses the Gordon formula to value all dividends after that as a terminal value at the end of the period, and discounts everything back to today.
Worked problem
A two-stage valuation
A firm just paid a dividend of $1.00. Dividends are expected to grow 15 % a year for four years, then 4 % forever. The required return is 11 %. Value the share.
Show solution
- Dividends: D₁ = 1.15, D₂ = 1.3225, D₃ = 1.5209, D₄ = 1.7490.
- PV of D₁ to D₄ at 11 % = 1.0360 + 1.0734 + 1.1121 + 1.1521 = 4.3736.
- D₅ = 1.7490 × 1.04 = 1.8190; terminal value at year 4 = 1.8190 ÷ (0.11 − 0.04) = 25.985.
- PV of terminal value = 25.985 ÷ 1.11⁴ = 17.117.
- P₀ = 4.374 + 17.117 = 21.49.
Answer: The share is worth about $21.49. Nearly 80 % of the value comes from the terminal value, which is why the long-run assumptions deserve the most scrutiny.
# Two-stage dividend discount model
def two_stage(d0, g_fast, years, g_long, r):
    pv, d = 0.0, d0
    for t in range(1, years + 1):
        d *= 1 + g_fast
        pv += d / (1 + r) ** t
    terminal = d * (1 + g_long) / (r - g_long)
    return pv, terminal / (1 + r) ** years

pv_div, pv_tv = two_stage(1.00, 0.15, 4, 0.04, 0.11)
print(f"PV of high-growth dividends {pv_div:.3f}  PV of terminal value {pv_tv:.3f}  price {pv_div + pv_tv:.2f}")
for g in (0.03, 0.04, 0.05):
    a, b = two_stage(1.00, 0.15, 4, g, 0.11)
print(f"long-run growth {g:.0%}: price {a + b:.2f}")PV of high-growth dividends 4.374 PV of terminal value 17.117 price 21.49 long-run growth 3%: price 19.21 long-run growth 4%: price 21.49 long-run growth 5%: price 24.54
Valuing the whole firm from free cash flow
Dividends are set by the board and many firms pay none, so analysts often value the whole business from its free cash flow instead, the measure defined in lesson 2. The discounted cash flow (DCF) approach forecasts free cash flow for several years, adds a terminal value, and discounts at the weighted average cost of capital (WACC, lesson 11), because free cash flow belongs to all investors, lenders and shareholders alike. The result is enterprise value. Subtracting the market value of debt and adding cash gives equity value; dividing by shares outstanding gives value per share.
Worked problem
A discounted cash flow valuation
A company's free cash flow is forecast at $40 million, $46 million and $52 million over the next three years, then growing 3 % a year forever. Its WACC is 9 %. It has $150 million of debt, $30 million of cash and 20 million shares. Estimate the value per share.
Show solution
- PV of explicit FCF = 40 ÷ 1.09 + 46 ÷ 1.09² + 52 ÷ 1.09³ = 36.70 + 38.72 + 40.15 = 115.57.
- Terminal value at year 3 = 52 × 1.03 ÷ (0.09 − 0.03) = 892.67; PV = 892.67 ÷ 1.09³ = 689.30.
- Enterprise value = 115.57 + 689.30 = 804.87.
- Equity value = 804.87 − 150 + 30 = 684.87; per share = 684.87 ÷ 20 = 34.24.
Answer: The estimate is about $34 per share. A change of one point in WACC or long-run growth would move it by several dollars, so a DCF should always be shown with its sensitivity to these inputs.
Valuation multiples
In practice many valuations rely on multiples: the price-earnings (P/E) ratio, enterprise value to EBITDA, price to book, or price to sales of comparable companies. If similar firms trade at 15 times earnings and the firm earns $3 per share, a first estimate of value is $45. Multiples are quick, use market information and are easy to explain. But they hide assumptions rather than avoiding them: a multiple is just a compressed DCF, and the Gordon model shows that a P/E ratio depends on payout, growth and risk, since \( P_0/EPS_1 = (1-b)/(r-g) \). Comparable firms are never identical, and if the whole market is mispriced, multiples carry the mispricing over.
Worked problem
Multiples and their meaning
Comparable companies trade at an average forward P/E of 16 and an EV/EBITDA of 9. The target expects EPS of $2.50 and EBITDA of $120 million, and has $200 million of net debt and 30 million shares. Estimate value per share both ways.
Show solution
- P/E approach: 16 × 2.50 = $40.00.
- EV/EBITDA approach: EV = 9 × 120 = 1,080; equity = 1,080 − 200 = 880; per share = 880 ÷ 30 = $29.33.
Answer: The two methods disagree by more than $10. The gap could reflect different leverage, accounting, growth or risk; the analyst must find out why before relying on either.
Market efficiency
If shares are valued by thousands of informed investors competing to find mispricing, prices should quickly reflect available information. This is the efficient market hypothesis. In its weak form, past prices cannot be used to predict future returns; in its semi-strong form, prices reflect all public information; in its strong form, even private information. The evidence suggests that large, liquid markets are reasonably efficient with respect to public information, which is why most actively managed funds fail to beat low-cost index funds after fees, but there are well-documented anomalies, bubbles and periods of mispricing. For a financial manager, efficiency has a practical message: the market price is usually a better guide to value than a single analyst's model, and a firm cannot easily create value by timing share issues or by accounting changes that do not affect cash flow.
Common mistakes
MistakeA share is worth its book value per share.
InsteadIts value is the present value of expected future cash flows to shareholders, which can be far above or below book.
MistakeRetaining more earnings always raises the share price because growth rises.
InsteadRetention creates value only if reinvestment earns more than the cost of equity.
MistakeUse the dividend just paid as D₁.
InsteadD₁ is next year's dividend: D₀ × (1 + g).
MistakeDiscount free cash flow to the firm at the cost of equity.
InsteadFCF belongs to all investors and is discounted at the WACC; equity value = enterprise value − debt + cash.
MistakeA low P/E means a share is cheap.
InsteadA low P/E can reflect low growth, high risk or poor reinvestment opportunities.
Summary and key terms
- A share is worth the present value of expected future dividends; with constant growth, P₀ = D₁ ÷ (r − g).
- Required return = dividend yield + growth.
- Sustainable growth = retention ratio × ROE; PVGO is positive only when reinvestment earns more than r.
- Multi-stage models add a terminal value; it often dominates the result.
- DCF valuation discounts free cash flow at the WACC to get enterprise value, then subtracts net debt.
- Multiples are compressed DCFs; P/E depends on payout, growth and risk.
- Large markets are reasonably efficient, so market prices are a useful benchmark.
- Common share
- A residual ownership claim with voting rights and limited liability.
- Preferred share
- A share with a fixed dividend that ranks ahead of common shares but usually lacks votes.
- Dividend discount model
- A model valuing a share as the present value of expected dividends.
- Gordon growth model
- The constant-growth dividend discount model, P₀ = D₁ ÷ (r − g).
- Retention ratio
- The fraction of earnings reinvested rather than paid out.
- Sustainable growth rate
- Retention ratio × return on equity.
- PVGO
- The present value of growth opportunities, the part of price beyond EPS₁ ÷ r.
- Terminal value
- The value at the end of a forecast period of all cash flows after it.
- Enterprise value
- The value of the operating business, equity plus debt minus cash.
- Efficient market hypothesis
- The idea that security prices quickly reflect available information.
Practice problems
Work each problem on paper first, then reveal the answer to check.
A preferred share pays $2.25 a year forever; investors require 6.5 %. Price?
Show answer
$34.62.
D₀ = $1.80, g = 5 %, r = 10 %. Price?
Show answer
1.89 ÷ 0.05 = $37.80.
Price $40, D₁ = $1.60, g = 6 %. Implied required return?
Show answer
4 % + 6 % = 10 %.
ROE 12 %, payout 30 %. Sustainable growth?
Show answer
0.7 × 12 % = 8.4 %.
EPS₁ = $4, r = 9 %, price $60. PVGO?
Show answer
60 − 44.44 = $15.56.
Dividends grow 20 % for 2 years from D₀ = $1, then 5 %; r = 12 %. Price?
Show answer
D₁ 1.20, D₂ 1.44; TV₂ = 1.512 ÷ 0.07 = 21.60; P = 1.071 + 1.148 + 17.219 = $19.44.
Why discount free cash flow to the firm at the WACC?
Show answer
Because it is available to all investors, lenders and shareholders.
EV 900, debt 300, cash 50, 25 million shares. Value per share?
Show answer
650 ÷ 25 = $26.
Payout 50 %, r = 10 %, g = 5 %. Implied forward P/E?
Show answer
0.5 ÷ 0.05 = 10.
Portfolio task: pick a dividend-paying company and estimate its implied required return from its price, forecast dividend and an assumed growth rate.
Show answer
Answers vary; show inputs and sources.
Lesson quiz · 5 questions
Score 60% or more to complete this lesson.
Create a free account to save your progress, take quizzes and earn a certificate.